Option Probabilities Spell Possible Trouble for U.S. Treasury Bonds
Interest-Rates / Options & Warrants Nov 15, 2013 - 04:56 PM GMTBy: J_W_Jones
 The incredible rally in equities in 2013 has begun to stir concern among many that the stock market is now in a bubble. We have entered the euphoric stage of this bull market and equity prices cannot and will not go lower according to some talking heads in the financial punditry.
While chatter is starting to heat up that equities are in a bubble, the real bubble seems to be ignored for the most part. The larger, more concerning bubble is in the Treasury marketplace where the Federal Reserve continues to print money to purchase treasury bonds to help keep interest rates artificially low.
Instead of debating the bubbles in Treasury’s versus equities, or trying to predict when the bubble in either asset class may pop, I want to focus on the near term for price action expectations in longer-dated Treasury bonds.
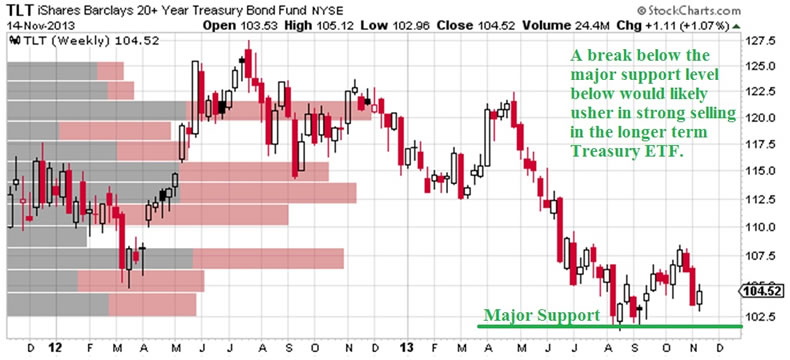
Below is a weekly chart of the Treasury ETF TLT which is supposed to reflect the price action and yield generation of a portfolio of 20+ year duration Treasury bonds issued by the U.S. federal government.
I have identified the key support areas which are supported by the price by volume indicator as well. No one in the financial media seems interested in discussing the nearly 13% drop year-to-date we have seen in longer-dated Treasury bonds shown above.
Furthermore, based on current price action we could see lower lows in the days and weeks ahead if price breaks below near-term support levels around $102.20 / share. I wanted to take this analysis one step further and look out into the future from an option trader’s perspective.
Based on the bill which was recently passed to reopen the government, there are two key dates which could impact Treasury bonds. The recently passed bill keeps the government open until January 15, 2014 at which point Congress will either compromise on a budget or accept additional sequester cuts. Furthermore, if no compromise is achieved and the sequester cuts are not favored, the federal government could shut down again.
The other key date is February 7th which is the date where Congress will yet again hit the debt ceiling. It is likely that through special measures the Treasury can push that date beyond February. However, the debt ceiling discussion will yet again impact government bonds as the threat of another default will likely emerge if recent discussions are any blueprint for the future.
Since the key dates are known, it allows option traders to focus on a specific expiration month. Based on the debt ceiling date of February 7, I wanted to look at the March 2014 TLT option chain for clues about what the options marketplace is indicating about any future event(s) and the potential impact on Treasury prices.
The first thing I did was to check the implied volatility of the various monthly option expirations and I found a glaringly obvious warning signal. The table shown below demonstrates that implied volatility is higher on the March 2014 options than the December or January expirations.
| Expiration Month | Implied Volatility – 11/14/13 Close |
| December Monthly | 11.95% |
| January Monthly | 12.17% |
| February Monthly | 12.57% |
| March Monthly | 13.20% |
The March 2014 option series has 10.46% more implied volatility than the December 2013 monthly option series based on the November 14th close. As can be seen above, the March monthly expiration has considerably higher implied volatility than the rest of the expiration series leading up to March.
Essentially this implied volatility skew is telling us that the option market believes that volatility will increase as we move into the March to April time frame. This corresponds with my expectations that Treasury’s may see serious price volatility late in the first quarter of 2014. The timeline fits nearly perfectly with the next debt ceiling discussion.
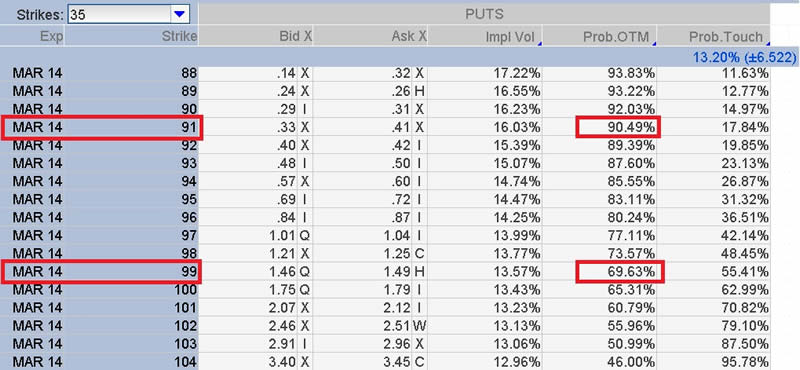
The next examination I look at is standard deviation based price levels to ascertain clues about the market’s expectations in the future. The TLT March 2014 monthly put option chain is shown below with the 1 standard deviation and 2 standard deviation price points highlighted.

The chart above illustrates the closing price levels on November 14, 2013. As can clearly be seen, the 99 strike is roughly 1 standard deviation (68% probability) lower from the closing price of $104.52 / share. A 2 standard deviation move (90% probability) corresponds with the 91 put strike.
What the March 2014 put option chain is telling probability based option traders is that implied volatility levels are indicating that there is a 68% probability that TLT closes above $99 / share. There is a 90% probability that price closes above $91 / share at the March monthly expiration. Now we will look at the call side of the March 2014 TLT option chain.

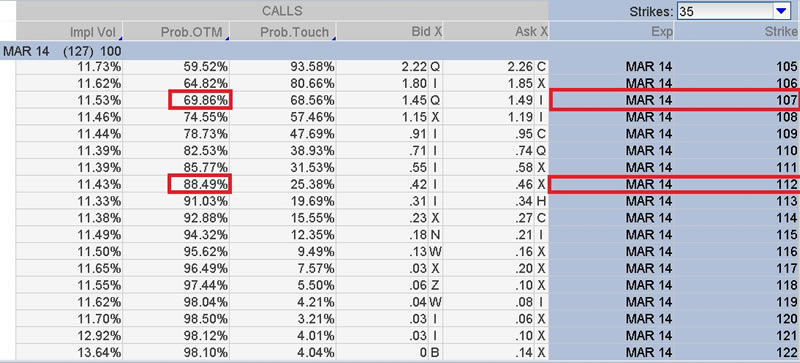
The closing price on November 13, 2013 was $104.52 / share. A 1 standard deviation (68% probability) corresponds to the 107 strike. A 2 standard deviation move (90% probability) corresponds with the 112 strike. Thus, there is a 68% probability that TLT closes below $107 / share at the March monthly option expiration. There is a 90% probability that price closes below $112 / share.
So what does this data tell option traders looking at probabilities? The answer is simple. The TLT March 2014 options’ implied volatility levels are telling us that presently the marketplace believes that TLT has a higher probability of being lower than today’s closing price of $104.52 / share on March 21, 2014.
There is a 68% probability that the price of TLT at the March expiration will be between $99 – $107 / share. There is a 90% probability that the price of TLT at the March expiration will be between $91 – $112 / share.
The one standard deviation upside strike is $107 / share which is just 2.37% above $104.52 / share. The downside strike is $99 / share which is 5.28% below today’s closing price. Based purely on those numbers, there is nearly a 2 : 1 probability that TLT’s closing price on March 21, 2014 will be below today’s closing price of $104.52 / share.
The same situation is true when we look at the 2 standard deviation predicted price range. The 90% probability upside target is $112 / share which would correspond with a 7.15% move to the upside. However, the 90% downside target is $91 / share which would correspond with a 12.93% move to the downside from today’s closing price.
I want to be clear that this does not mean TLT’s price will go down for sure. It is merely a road map as to what TLT’s option chain is indicating about future price action. It is without question that the implied volatility levels in March TLT options indicate that there is risk ahead regarding Treasury bonds.
Whether the risk revolves around the debt ceiling debate or a possible taper from the Federal Reserve is hard to know for sure, but at this point TLT is nearly 2 times more likely to move lower in the months ahead.
If you are looking for a mathematical and statistical based approach to trading, OptionsTradingSignals.com may be a perfect fit to improve your option trading results. Give OptionsTradingSignals.com a try today!
J.W. Jones is an independent options trader using multiple forms of analysis to guide his option trading strategies. Jones has an extensive background in portfolio analysis and analytics as well as risk analysis. J.W. strives to reach traders that are missing opportunities trading options and commits to writing content which is not only educational, but entertaining as well. Regular readers will develop the knowledge and skills to trade options competently over time. Jones focuses on writing spreads in situations where risk is clearly defined and high potential returns can be realized.
This article is intended solely for information purposes. The opinions are those of the author only. Please conduct further research and consult your financial advisor before making any investment/trading decision. No responsibility can be accepted for losses that may result as a consequence of trading on the basis of this analysis.
© 2005-2022 http://www.MarketOracle.co.uk - The Market Oracle is a FREE Daily Financial Markets Analysis & Forecasting online publication.


