


Gold And Silver Price Decline Not Over
Commodities / Gold and Silver 2013 Nov 23, 2013 - 04:07 PM GMTBy: Michael_Noonan

 However important underlying fundamentals are, in terms of supply v demand, they have been and continue to be of little to no use in determining when reality will reenter the market. When that happens, price will adjust and reflect the true picture of gold and silver's record [demand]accumulation.
All that matters for now is the political situation involving the moneychangers and their puppet government regimes giving them cover during the end game of their world-wide theft. Just last Thursday, we saw once again another "smash-down" in gold futures. At one of the best possible times to assure liquidity and excellent execution, 1,500 contracts were sold around 5:30 a.m., CST. Who needs to worry about getting good fills when the only objective is to intentionally move the market lower?
In the past few months, we have acknowledged leaning to any price turn taking a year, or more, rather than sooner, and market activity continues to bear that out. No matter what the latest "news" development is for PMs that paints a rosy picture, those in the fundamentalist camp are looking through rose-colored glasses to expect change in the near future. The charts continue to tell a more accurate story that belie all known| fundamentals, and the charts shown here depict a market in decline with no apparent end in sight.
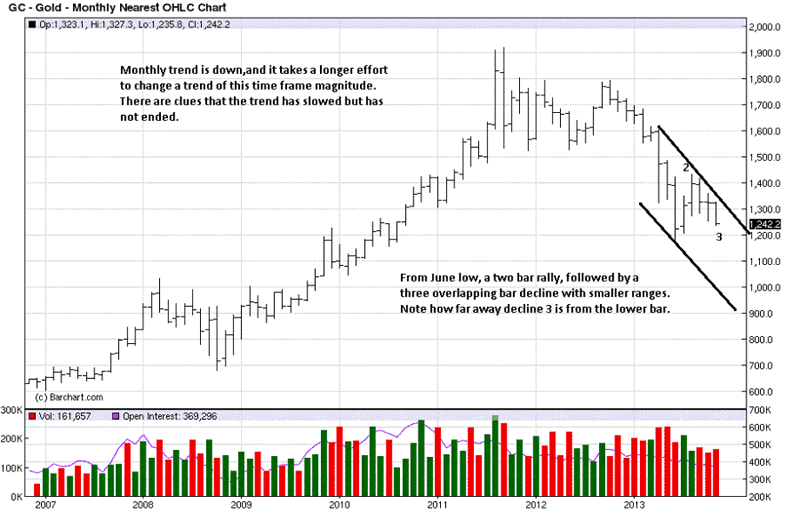
The month is not yet over, and anything can happen before the 30th. A monthly chart is presented to show how the last three months have had overlapping bars. This means there is a greater battle between buyers and sellers at a level where sellers should be in total control.
Contrast the last three bars with the two preceding, and the other two rally bars show less overlap, indicating greater EUM, [Ease of Upward Movement]. The ranges of the two rally bars are also larger than the last three decline bars which supports the conclusions made.
It takes more time and greater effort to turn a monthly trend than a weekly or a daily one. While there is no evidence of a turn in trend, the fact that price is hugging the upper down channel line is more positive. In a down market, one would expect to see price hugging the lower channel line.
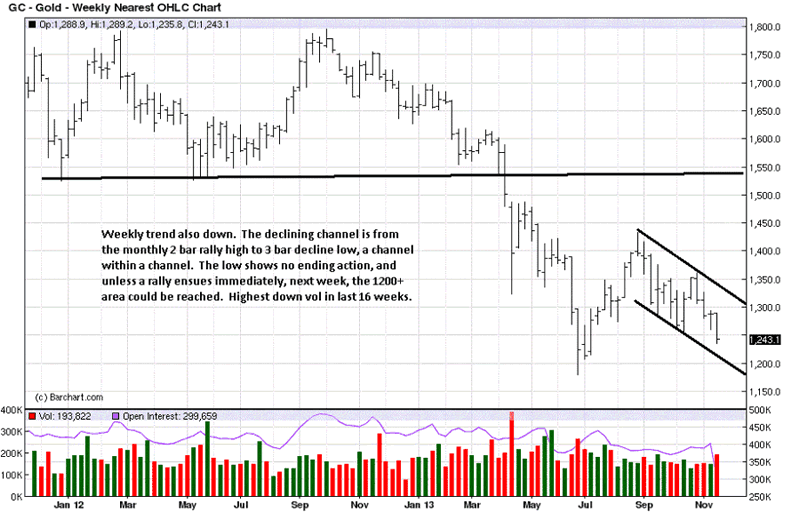
The weekly shows a slightly different picture with price nearer the lower channel line. We can infer price is closer to a potential support area, and volume increased in the process. The significance of the increase in volume is addressed on the daily chart, and again on the silver weekly/daily charts.
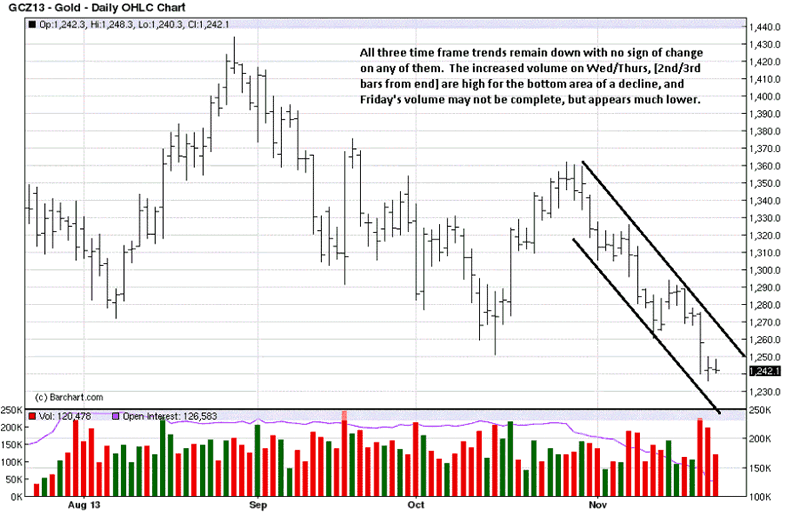
The daily is a more complicated read, yet revealing about that 1,500 contract sale, seen on the third bar from the end with a sharp volume increase. One would expect a big "win" for the bears, with all that unopposed selling, yet the location of the close, mid-range the bar, tells us buyers were equally present, keeping price from closing lower.
It is the nest two trading days that make the read more complicated. Thursday, 2nd bar from the end, only went marginally lower than Wednesday's low and closed higher than the opening. Volume was much higher than average, of late, so buyers were again present, keeping price from extending lower. Friday's activity is the coin toss.
After two days of showing some presence, buyers could not take advantage and rally price higher. At the same time, sellers could not take advantage of the trend momentum and press price lower. This makes Friday an inside day, and the range was small. From small ranges, a form of market balance, we can expect imbalance to follow. Note the small bar, 4th from the end. It led to a wide-range imbalance sell-off, next day.
The advantage of reading developing market activity, as we are doing, is you do not have to know in advance in which direction price will move. Instead, we assess the situation and prepare accordingly, following the market is it moves directionally.
This analysis is all about the paper futures market, and there is no reason to be on the long side. As to the physical, continued buying is always recommended, especially at these low levels. The reason for buying is to own and hold the physical in opposition to the central banker's worthless fiat issue, as the most effective means of preservation/protection of one's capital.
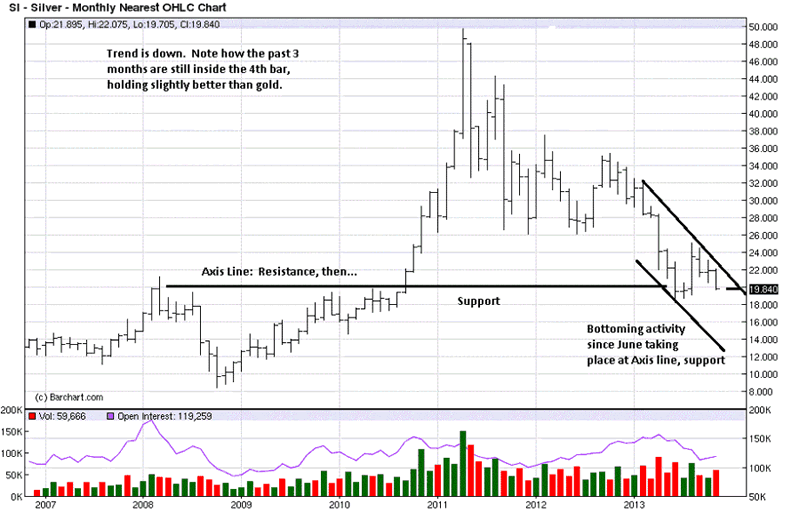
Monthly silver is holding better than gold by virtue of the last three bars contained in the range of the 4th bar. Gold's 4th bar has already been exceeded, downside. The message is one of effort v result. The 4th bar shows EUM, and the next three down bars are labored, by comparison.
Price is staying closer to the upper channel line, [resistance], and not reacting away from it. Plus, all the activity is occurring at an Axis line, a line that acts as support in one area, then becomes resistance, or vice versa, as here.
The trend has not ended, but it is showing potential for change as much for continuation.
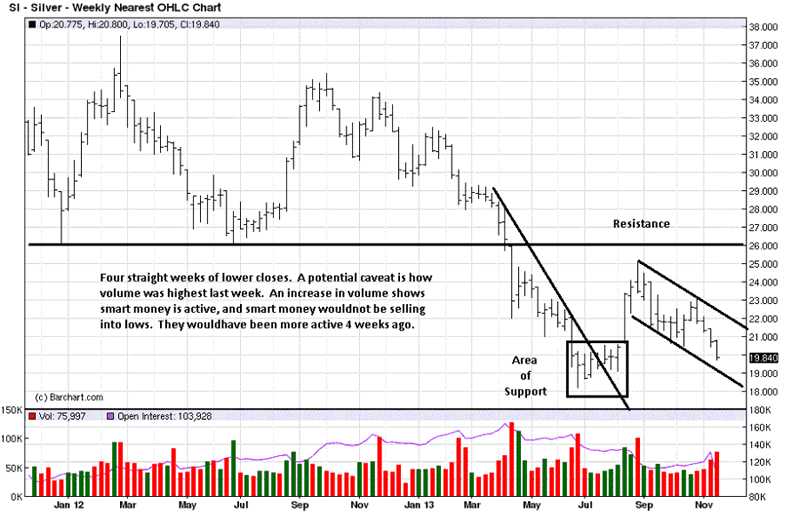
Volume is the market's energy indicator. The greater the volume, especially at an area of support, [and resistance, as well], the greater one needs to pay attention. It is "smart money" that creates volume and moves markets. It is the public that responds, almost always at the wrong time, [selling lows, buying highs].
If smart money wants to move a market lower, it sells, [creating greater volume] at higher price levels, in anticipation of buying in at lower levels. Look at the high volume low in June. Weak hands were selling, sell stops being triggered, while smart money was on the other side, buying. Then note the high volume at the swing high at the end of August, the reverse effect.
Will the same hold true for this past week? We do not know. Volume was not as great, but we do not need to know, in advance. If a swing low develops, there will be evidence of one on the lower time frames that may afford a low-risk entry. That, in turn, depends on ones' trading style. The point is to see how it is the market that provides the most reliable information.
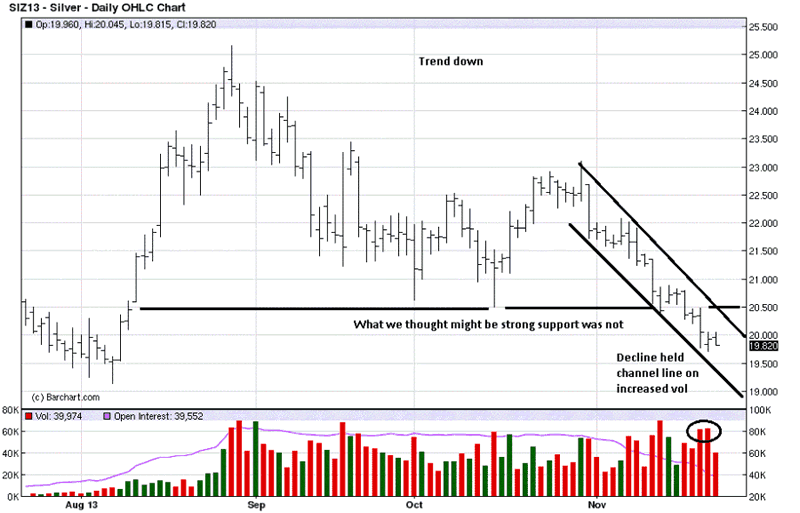
The daily chart appears as the weakest in position of the three time frames. It is closer to a potential turnaround, or ready to head for new lows.
The increase in volume on Wednesday, and slightly higher on Thursday tell of a potential story as the daily gold chart. It is always best to let the market show its hand, and then follow. Examples of that were given on the weekly chart with the June low and August high. These signs work on all time frames.
Buyers, or Stackers, should continue unabated. Those looking to trade paper futures have no reason to buy. We have not been advocates of the short side, just because we do not like the company and refuse to be a party to their efforts.
By Michael Noonan
Michael Noonan, mn@edgetraderplus.com, is a Chicago-based trader with over 30 years in the business. His sole approach to analysis is derived from developing market pattern behavior, found in the form of Price, Volume, and Time, and it is generated from the best source possible, the market itself.
© 2013 Copyright Michael Noonan - All Rights Reserved Disclaimer: The above is a matter of opinion provided for general information purposes only and is not intended as investment advice. Information and analysis above are derived from sources and utilising methods believed to be reliable, but we cannot accept responsibility for any losses you may incur as a result of this analysis. Individuals should consult with their personal financial advisors.
Michael Noonan Archive |
© 2005-2022 http://www.MarketOracle.co.uk - The Market Oracle is a FREE Daily Financial Markets Analysis & Forecasting online publication.