


Gold Bullion ETF and Fund Drain - Comex Registered Stocks at 69 to 1
Commodities / Gold and Silver 2013 Nov 26, 2013 - 01:15 PM GMTBy: Jesse

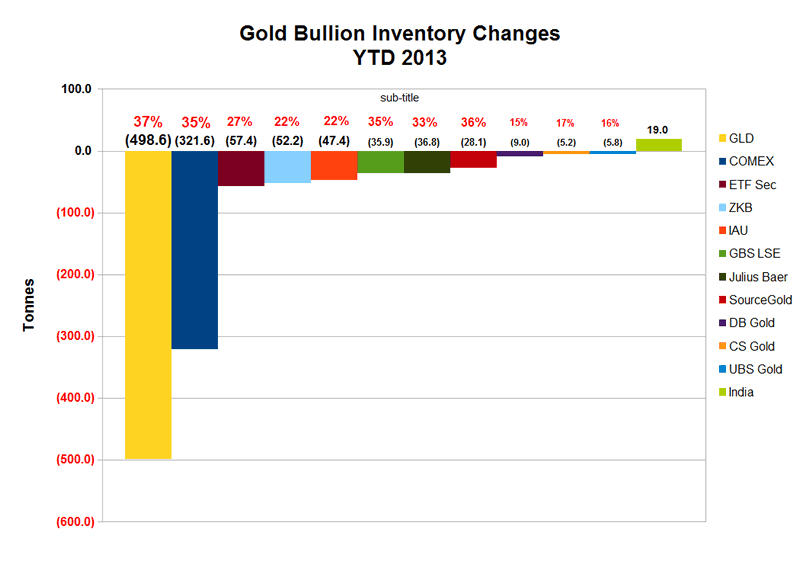
 This chart shows the amount of gold that has been taken out of the vaults of various funds and ETFs since the beginning of this year.
The number in black is the total number of tonnes that have been removed from their vaults, presumably to be sold off into the market, most likely heading for points East.
The number in red is the percent decline in the fund or ETF total inventory this year.
The more I look into this, the more I see the fingers of a few western bullion banks, with their activities centered in New York and London, with some minor involvement from the Swiss.
Physical supplies are a bit thin. That seems to be clear from various analyses of flows of gold from West to East. Even with the steep price declines in silver, there is absolutely nothing comparable to this happening with the silver ETFs and Funds.
I read a bank analyst opinion today that the declines in gold bullion inventory show 'investor disenchantment' with gold bullion. That might be more credible if the supplies of bullion held in these funds were not primarily determined by bullion banks, who are also playing the markets for their own books.
I am fascinated at the apparent repeal of the law of supply and demand.
One wonders where the gold will be obtained when this trend reverses. Venezuela seems to be willing to swap its sovereign wealth into the market. Germany and a few other countries are already there.
Weighed and found wanting.
Stand and deliver.
As always, this data is supplied by master data wrangler Nick Laird at Sharelynx.com.
This comes from a much larger chart of almost every major gold bullion publicly disclosed vault. I carve out those with major holdings and present them individually on this chart.
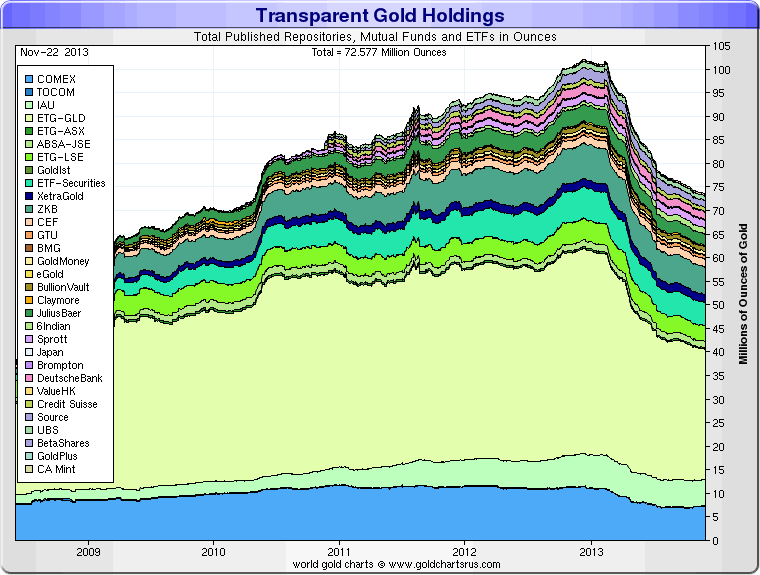
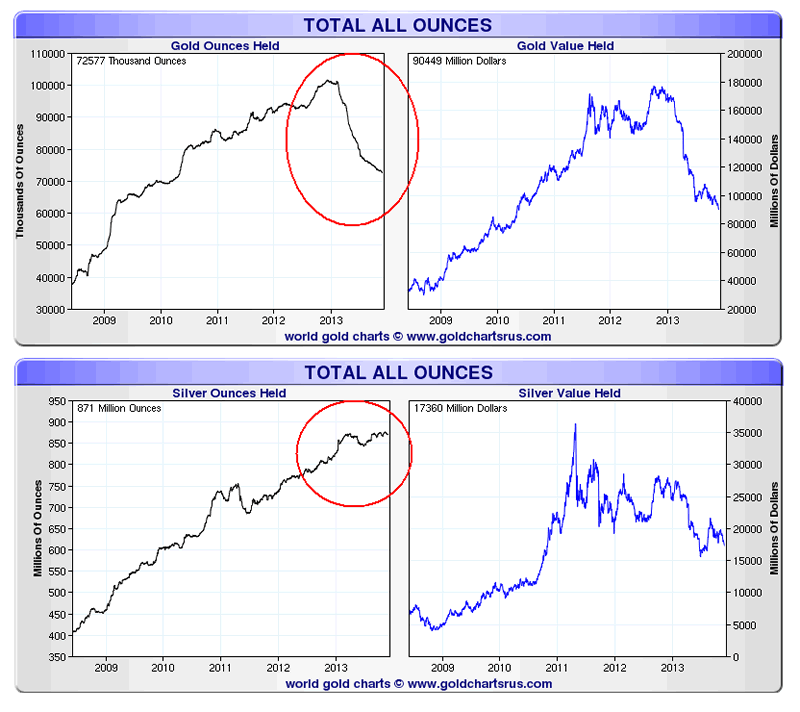
Here is the chart in which Nick shows all 'transparently held' gold and silver in these public funds and ETFs as a single total.
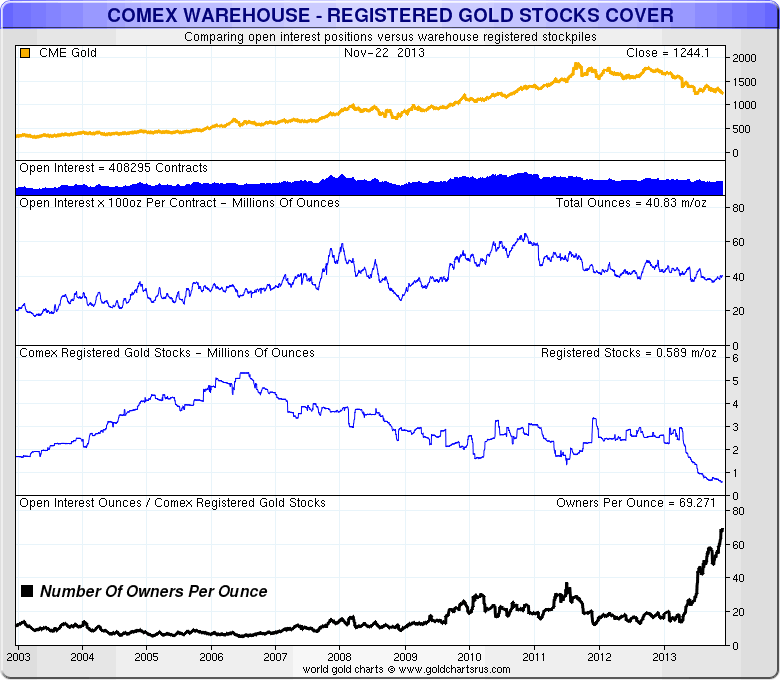
For those who have expressed an interest here is the latest potential 'Owners Per Ounce' for gold bullion that is deliverable at these prices at the Comex. The figure in the chart above is for total gold in all Comex warehouses, both deliverable and that which is in customer storage.
By Jesse
http://jessescrossroadscafe.blogspot.com
Welcome to Jesse's Café Américain - These are personal observations about the economy and the markets. In plewis
roviding information, we hope this allows you to make your own decisions in an informed manner, even if it is from learning by our mistakes, which are many.
© 2013 Copyright Jesse's Café Américain - All Rights Reserved
Disclaimer: The above is a matter of opinion provided for general information purposes only and is not intended as investment advice. Information and analysis above are derived from sources and utilising methods believed to be reliable, but we cannot accept responsibility for any losses you may incur as a result of this analysis. Individuals should consult with their personal financial advisors.
Jesse Archive |
© 2005-2022 http://www.MarketOracle.co.uk - The Market Oracle is a FREE Daily Financial Markets Analysis & Forecasting online publication.