


The Fed Must Inflate or Die
Economics / Inflation Nov 28, 2013 - 12:20 PM GMTBy: MISES

 Chris Martenson writes: The Fed is busy doing everything in its considerable power to get credit (that is, debt) growing again so that we can get back to what it considers to be “normal.”
But the problem is that the recent past was not normal. You may have already seen this next chart. It shows total debt in the U.S. as a percent of GDP:
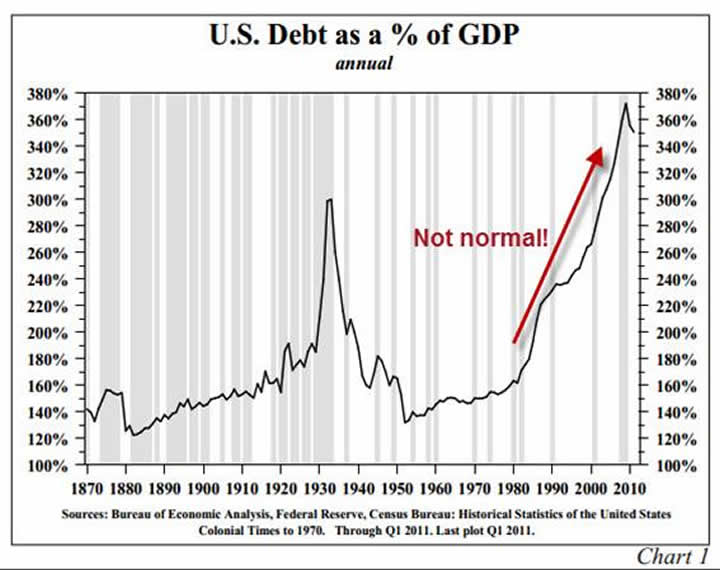
Somewhere right around 1980, things really changed, and debt began climbing far faster than GDP. And that, right there, is the long and the short of why any attempt to continue the behavior that got us to this point is certain to fail.
It is simply not possible to grow your debts faster than your income forever. However, that’s been the practice since 1980, and current politicians and Federal Reserve officials developed their opinions about “how the world works” during the 33-year period between 1980 and 2013.
Put bluntly, they want to get us back on that same track, and as soon as possible. The reason? Because every major power center, be that in D.C. or on Wall Street, tuned their thinking, systems, and sense of entitlement, during that period. And, frankly, a huge number of financial firms and political careers will melt away if and when that credit expansion finally stops. And stop it will; that’s just a mathematical certainty.
Total Credit Market Debt (TCMD) is a measure of all the various forms of debt in the U.S. That includes corporate, state, federal, and household borrowing. So student loans are in there, as are auto loans, mortgages, and municipal and federal debt. It’s pretty much everything debt-related. What it does not include, though, are any unfunded obligations, entitlements, or other types of liabilities. So the Social Security shortfalls are not in there, nor are the underfunded pensions at the state or corporate levels. TCMD is just debt, plain and simple.
As you can see in this next chart, since 1970, TCMD has been growing almost exponentially.
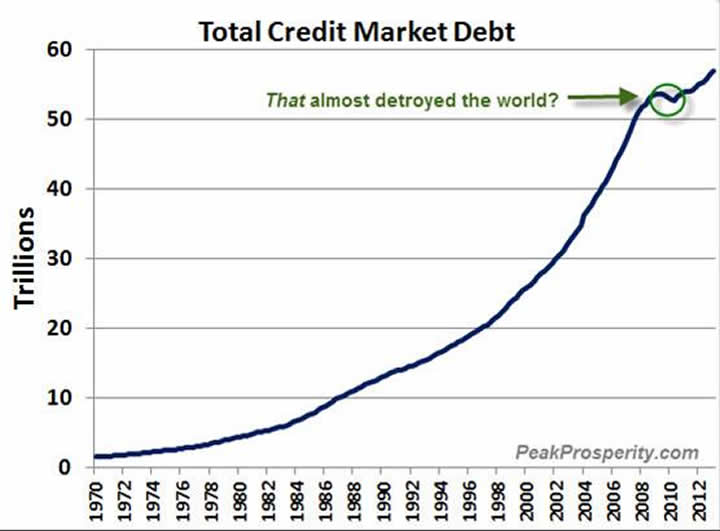
That tiny little wiggle happened in 2008-2009, and it apparently nearly brought down the entire global financial system. That little deviation was practically too much all on its own for the markets to handle.
Now debts are climbing again at a quite nice pace. That’s mainly due to the Fed monetizing U.S. federal debt just to keep things patched together. As an aside, based on this chart, we’d expect the Fed to not end their QE efforts until and unless households and corporations once more engage in robust borrowing. The system apparently needs borrowing to keep growing exponentially, or it risks collapse.
One could ask why credit can’t just keep growing. But there are many reasons to believe that the future will not resemble the past. Let’s start in 1980, when credit growth really took off. This period also happens to be the happy time that the Fed is trying (desperately) to recreate. Between 1980 and 2013, total credit grew by an astonishing 8 percent per year, compounded. I say “astonishing” because anything growing by 8 percent per year will fully double every 9 years. So let’s run the math experiment and ask what will happen if the Fed is successful and total credit grows for the next 30 years at exactly the same rate it did over the prior 30. That’s all. This is nothing fancy, and it is simply the same rate of growth that everybody got accustomed to while they were figuring out “how the world works.”
What happens to the current $57 trillion in TCMD as it advances by 8 percent per year for 30 years? It mushrooms into a silly number: $573 trillion. That is, an 8 percent growth paradigm gives us a 10-fold increase in total credit in just 30 years:
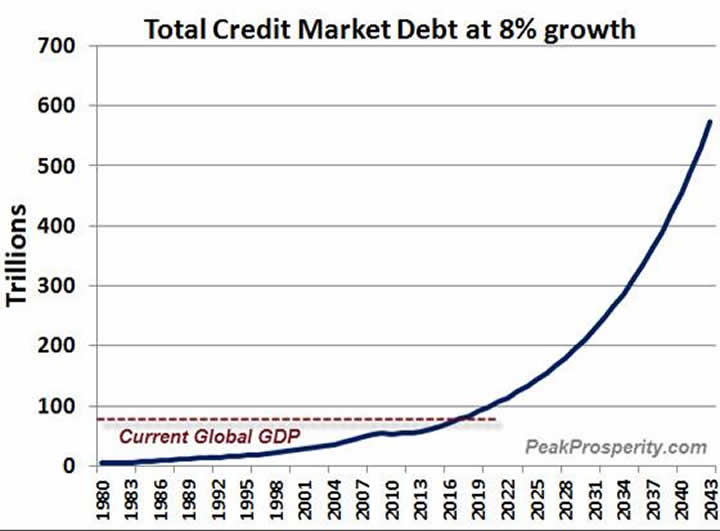
For perspective, the GDP of the entire globe was just $85 trillion in 2012. Even if we advance global GDP by some hefty number, like 4 percent per year for the next 30 years, under an 8 percent growth regime, U.S. credit would be twice as large as global GDP in 2043.
If that comparison didn’t do it for you, then just ask yourself: Why, exactly, would U.S. corporations, households, and government borrow more than $500 trillion over the next 30 years?
The total mortgage market is currently $10 trillion, so might the plan include developing an additional 50 more U.S. residential real estate markets?
So perhaps the situation moderates a bit, and instead of growing at 8 percent, credit market debt grows at just half that rate. So what happens if credit just grows by 4 percent per year? That gets us to $185 trillion, or another $128 trillion higher than today — a more than 3x increase. Again: for what will we borrow (only) $128 trillion for, over the next 30 years?
When I run these numbers, I am entirely confident that the rate of growth in debt between 1980 and 2013 will not be recreated between 2013 and 2043. But, I’ve been assuming that dollars remain valuable. If dollars were to lose 90 percent or more of their value (say, perhaps due to our central bank creating too many of them), then it’s entirely possible to achieve any sorts of fantastical numbers one wishes to see.
For the Fed to achieve anything even close to the historical rate of credit growth, the dollar will have to lose a lot of value. This may in fact be the Fed’s grand plan, and it’s entirely about keeping the financial system primed with sufficient new credit to prevent it from imploding.
Note: The views expressed in Daily Articles on Mises.org are not necessarily those of the Mises Institute.
Comment on this article. When commenting, please post a concise, civil, and informative comment.
Chris Martenson is a former biochemical scientist. Currently he is a writer and trend forecaster interested in macro trends regarding the economy, energy composition and environment. He is the founder of PeakProsperity.com. See Chris Martenson's article archives.
© 2013 Copyright Chris Martenson- All Rights Reserved Disclaimer: The above is a matter of opinion provided for general information purposes only and is not intended as investment advice. Information and analysis above are derived from sources and utilising methods believed to be reliable, but we cannot accept responsibility for any losses you may incur as a result of this analysis. Individuals should consult with their personal financial advisors.
© 2005-2022 http://www.MarketOracle.co.uk - The Market Oracle is a FREE Daily Financial Markets Analysis & Forecasting online publication.