Stock Market Rally Stretched to its Limit
Stock-Markets / Stock Markets 2013 Dec 02, 2013 - 01:01 PM GMTBy: Andre_Gratian
 Current Position of the Market
SPX: Very Long-term trend - The very-long-term cycles are in their down phases, and if they make their lows when expected (after this bull market is over), there will be another steep decline into late 2014. However, the severe correction of 2007-2009 may have curtailed the full downward pressure potential of the 40-yr and 120-yr cycles.
Intermediate trend - An important top formation is in the making.
Analysis of the short-term trend is done on a daily basis with the help of hourly charts. It is an important adjunct to the analysis of daily and weekly charts which discusses the course of longer market trends.
STRETCHED TO THE LIMIT
Market Overview
Last week's newsletter stated: "By Friday's close, SPX had reached the minimum projection that was assigned to minute wave 5 (of intermediate V, of major 5, of primary III) -- a price level that could end the entire trend from October 2011--- And yet --- in the midst of all these negatives, there is a suggestion that we could go slightly beyond the "minimum" projection of 1804 before rolling over. Another 10 or fifteen points, maybe?"
Last week fulfilled this expectation with a rally extension to 1813.55. This was a little short of the preferred 1818 target, but the quick drop of 10 points in the last hour of trading suggests that the bull may be exhausted and ready to hand the baton over to the bear -- for now. Initial confirmation will come when the index drops below 1800, and then follows through by trading below 1776.
This action would imply that primary wave III may have topped at Friday's high and that primary iv is on its way. But a caveat is in order: If we fail to get enough weakness in the forthcoming correction, it will mean that an extension to the structure has become a possibility, and we should watch for the bulls to recover and drive SPX to new highs before we get to the top of primary III. They are still in control of the long-term uptrend and may be reluctant to relinquish it too early. This could also be accomplished with a sub-par correction of wave IV. I will let the EW experts decide on the structural outcome and stick to my TA to monitor the market.
In the meantime, the over-extended condition of the index which should find resistance at the top channel line, the loss of upside momentum made glaringly evident by negative divergence in daily and hourly oscillators, and the reaching of the projection target - conditions which existed at the end of last week - continue to wave a bright red flag. This week, however, we can add two more warnings: Friday's last minute price action in the SPX, and the performance of the VIX, which we will study a little later on.
Chart Analysis
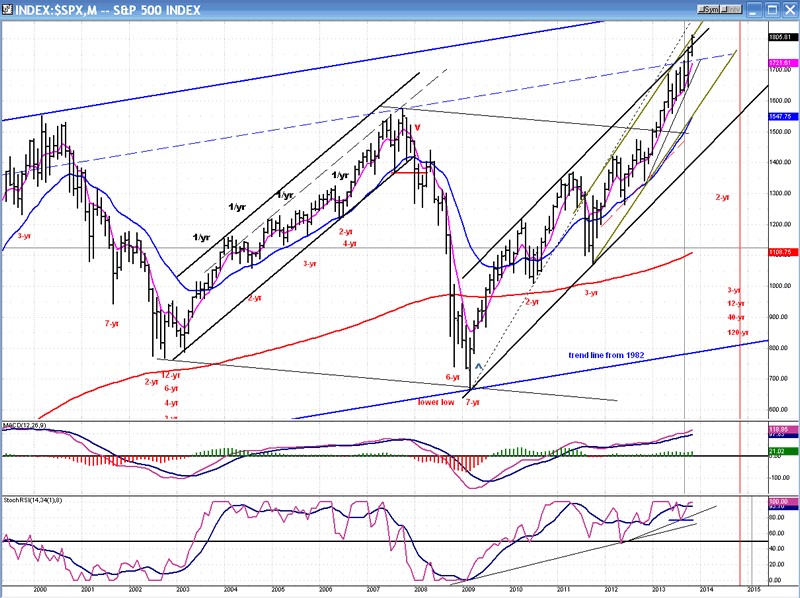
The SPX weekly chart did not do anything which cannot be observed in the daily chart, but the monthly chart (courtesy of QCharts, as are the following two charts) did something which deserves mention.
From the 2009 low, the bull market was traveling in a well-defined channel which contained all important price highs and lows. In May of this year, SPX extended its uptrend to the top of the channel and started to correct, but instead of continuing to the bottom of the channel, it found support one third of the way down and started pushing upward again. By November, it had continued upward, poked its head through the top channel line and closed above it last Friday. Analysts look for this type of action to signal the end of a rally which has achieved climactic proportions and is ready to correct. That, of course, is under normal conditions! The Fed's QE practice has distorted the normal supply/demand relationship to the extent that the bull market is progressing beyond what should have been the end of its term.
This is particularly evident when you consider how regular the long-term cycles have been. The nest of important cycles bottoming a year from now has not managed to pull the market down, yet. But with every month, we come closer and closer to the outcome of the battle between humans and nature, and there is very little doubt who will win eventually. What could happen is that the longer the cycles are denied their basic rhythm, the more likely they will suddenly play catch-up when they finally regain control, and the last few months into October 2014 could see a severe decline.
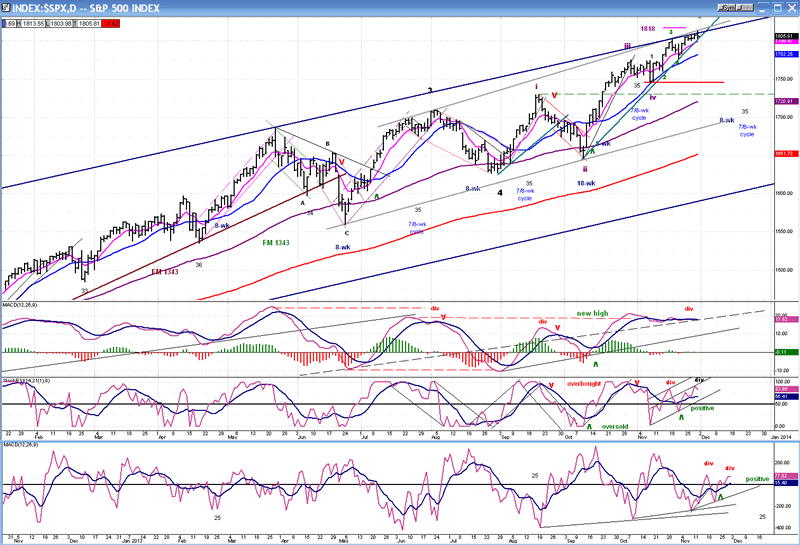
The daily chart shows why it will be difficult for the SPX to make further progress before correcting. Prices have reached the intersection of two top channel lines: the dark blue are the ones which delineate the uptrend since the October 2011 intermediate low. The shorter, grey channel only envelops the price structure from June of this year.
In addition, all the arguments made over the past two weeks about the technical condition of the market are still valid and even more so. These are best seen in the position of the oscillators, all three of which show deceleration expressed as negative divergence, with the bottom one (breadth) showing the greatest weakness. Friday's action managed to turn all of them down slightly. Continuing to roll over would mean that the decline which started at the end of the day is continuing. When they go negative, the correction will be confirmed. However, the MACD is still high and it is not certain that it can go negative without some sort of bounce when it touches the zero line perhaps in conjunction with the start of a new near-term uptrend.
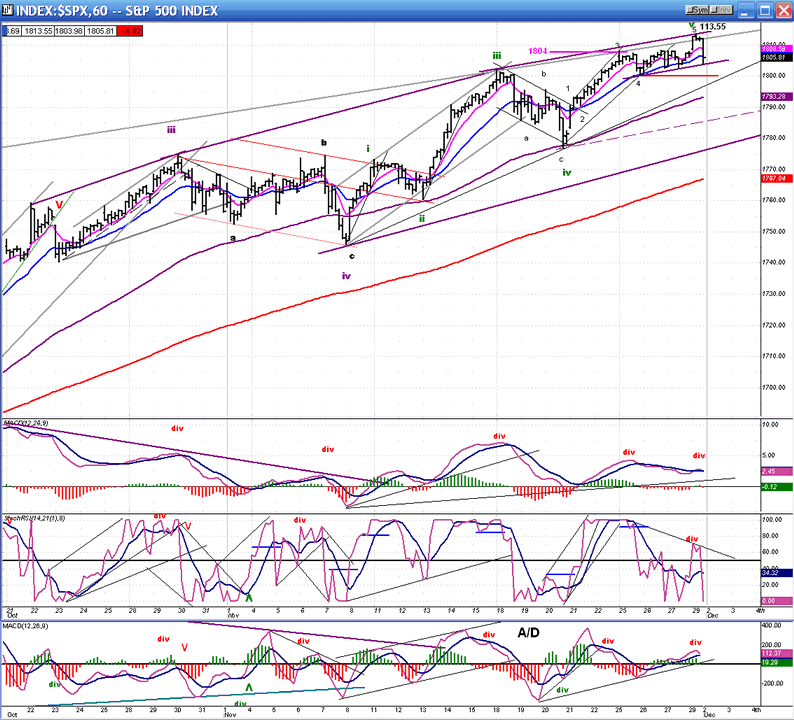
In the hourly chart, the purple trend lines connecting the various tops show the price deceleration process which is taking place; together, they form a rounding top. The main channel lines from 10/11 are not shown on this chart but, over the past two weeks, the grey, top channel line has provided resistance for the last three peaks. The converging top lines and rising trend line combine to form a wedge pattern which also represents deceleration and is bearish.
This progressive weakness is best seen in the oscillators which all exhibit negative divergence with the MACD showing triple -- and even quadruple -- negative divergence if we start the peak comparison with that of October 21. It is important to note, however, that the two MACDS (price and A/D) are still positive and that they will have to turn negative before a sell signal is confirmed. The SRSI has already done that since it was knocked back down just as it was trying to rise for an extension of the uptrend.
I continue to follow the best EW interpretation available, noting that wave 5 remains unconfirmed and could still extend higher, although it really does not have anywhere to go considering the resistance provided by the top channel lines displayed on the various charts.
Cycles
Right translation is obvious on all the longer term cycles scheduled to bottom next October. But the pattern of right translation discussed earlier concerns short-term and intermediate-term cycles which are topping in this time frame.
We also discussed an 8-wk cycle (closely followed by a 7/8-wk cycle) that was due in the middle of next month. Downward pressure from these should help getting something started on the downside.
Breadth
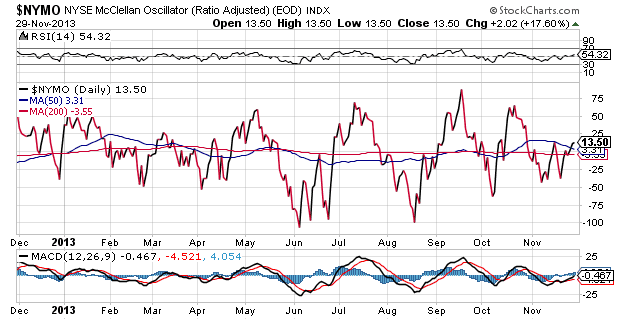
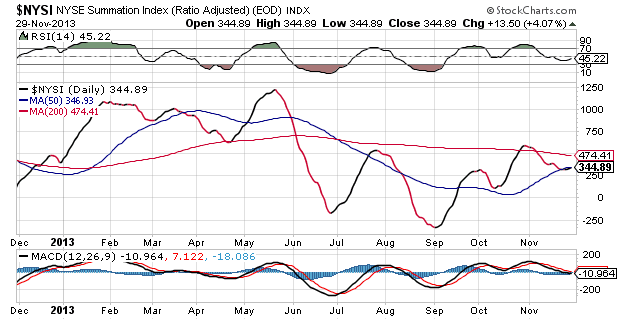
The McClellan Oscillator and the Summation index (courtesy of StockCharts.com) appear below.
The McClellan Oscillator has mostly been confined to negative readings during the whole month of November as SPX was making new highs. Here also, negative divergence is very obvious, and it normally precedes a price correction.
The NYSI has not been trading above its 200 DMA since June except for a very brief period in October. To the short-term divergence, the NYSI adds long-term divergence -- not a good combination for price performance ahead.
Sentiment Indicators
The SentimenTrader (courtesy of same) long term indicator closed at 70 for the 4th consecutive week. This is good enough for a short to intermediate top.

VIX
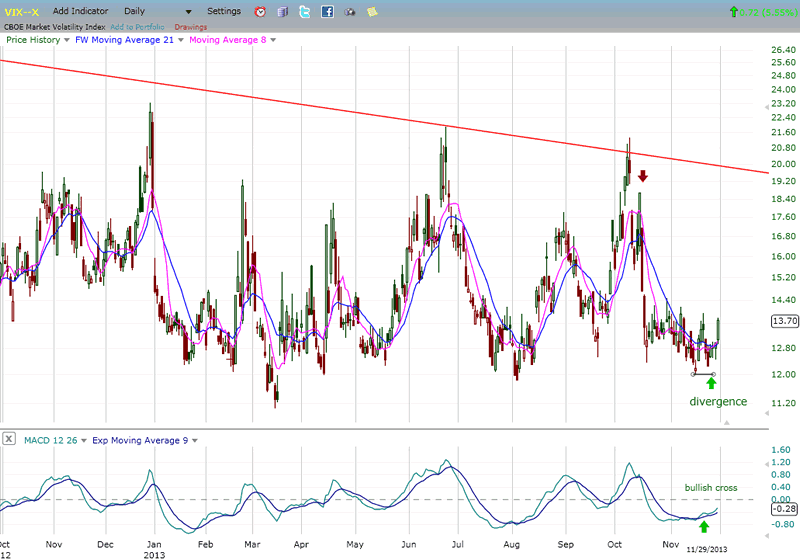
VIX showed some signs of life on Friday. Not only was it moving up when the market started to move down, but it continued to move up and closed on its high of the day.
On 11/15, VIX made a slightly new low, but retained its longer term divergence with the SPX going back to March. On 11/22, it showed some short-term divergence as the index was making new highs. On Friday, it started to move up early as SPX was trying to push higher, culminating the day with what looks like an attempt at breaking out.
These are all signs of a topping market, but in order to confirm the beginning of a decline in the SPX, VIX will have to follow through, beginning with overcoming its 14.00 and 14.50 level. It has built enough of a base to move to about 20, initially.
IWM (ETF for Russell 2000)
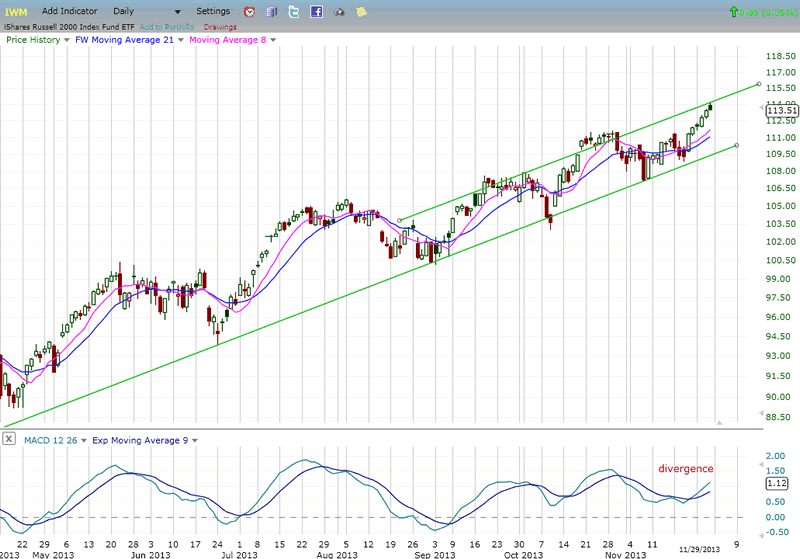
From the middle of October to the middle of November, IWM went through a period of relative weakness to the SPX, an indication that a top might be forming in the market. However, as SPX and others pushed on, IWM conceded that this was a false alarm and joined the rest of the indices making all-time highs. In spite of this new-found strength, IWM retains some slight relative weakness to the SPX, but not enough to tell us with certainty that the market has found a genuine top.
BONDS
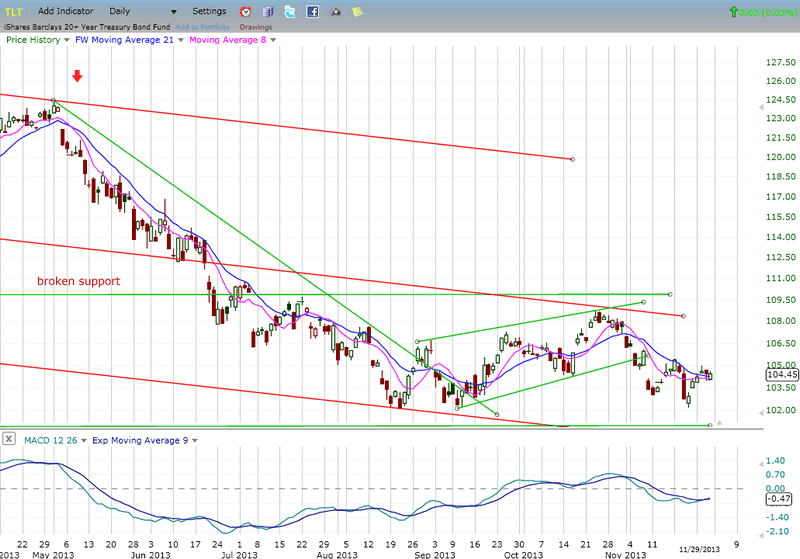
TLT does not look ready to go anywhere fast. It found resistance just below a broken support level and has, so far, successfully re-tested its recent low. More time is needed to see if it is building a base to attempt a rally, or if it is merely consolidating on the way down to a lower long-term low.
GLD (ETF for gold)
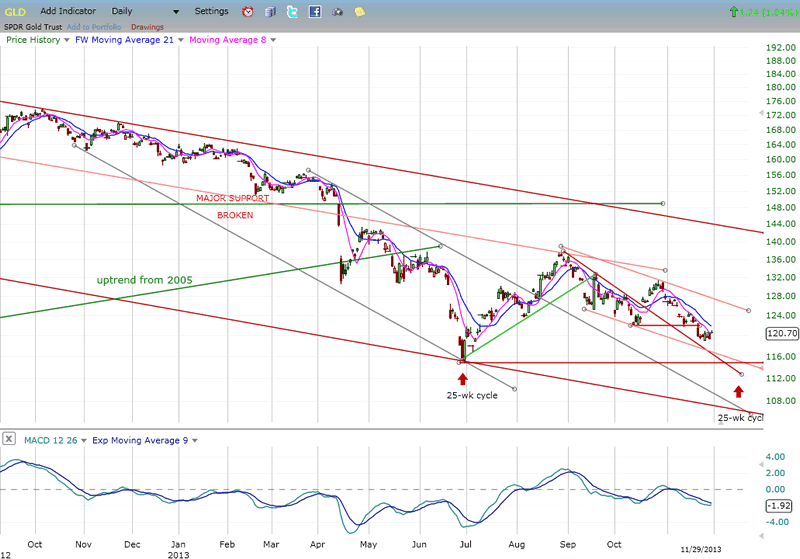
GLD is pushing down into its 25-26 week cycle low which is due around the middle of December or a little later. The structure is not clear enough to tell us if it is in the process of completing another move down beyond the previous low, or if it will be satisfied with simply re-testing that low. In any case, it is unlikely to attempt a genuine reversal until the cycle has bottomed.
UUP (dollar ETF)
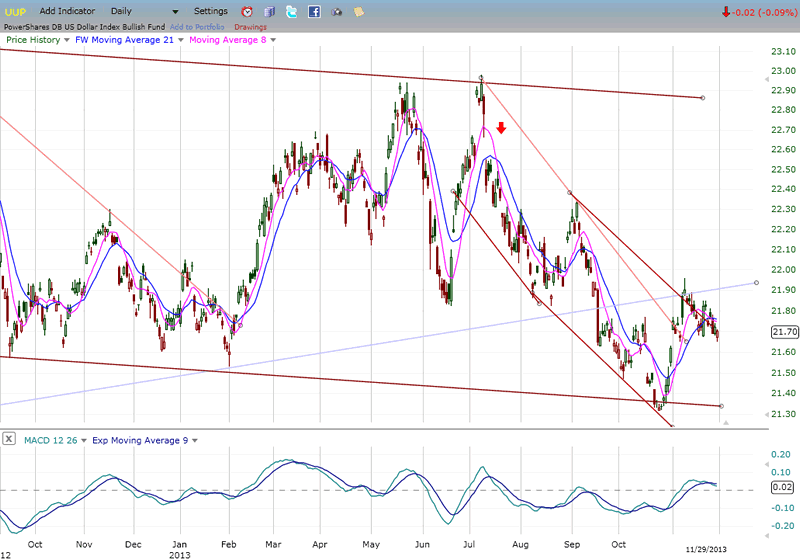
UUP is undergoing a consolidation after an intial attempt at breaking out of its down-channel. If it is subject to the same cyclic forces as GLD (but in reverse) it should have another move higher before undergoing more consolidation. The MACD has remained positive during the consolidation process, and this bodes well for another rise over the short term.
USO (United States Oil Fund)
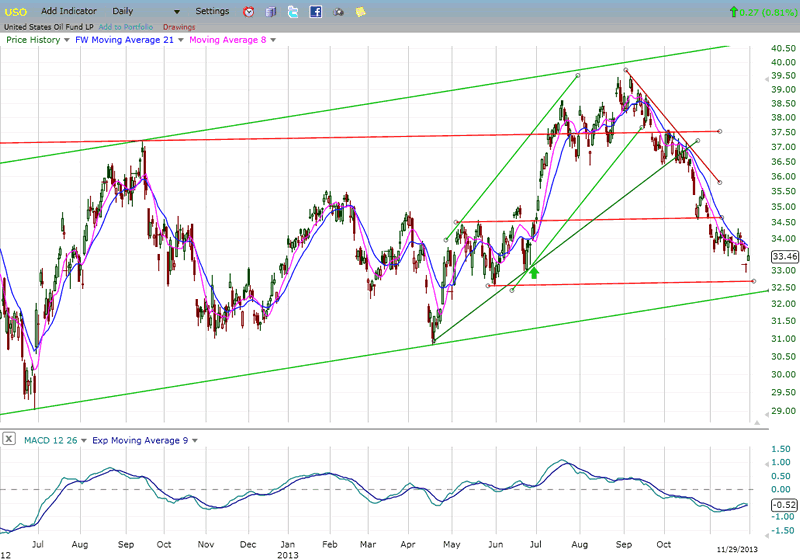
USO has shown a great deal of short-term weakness, penetrating far below the top of what should have been a good support level. It seems bent on reaching the bottom of its long-term up-channel --which also coincides with the long-term bull market trend line. This should at least provide good temporary support, but I would expect it to be broken in the next bear-market decline.
Summary
The last few weeks have brought us closer and closer to some sort of market top. In the last newsletter I wrote that the onus was on SPX to show us that it could continue its uptrend. Last week, it tried for a few additional points, but this only aggravated the already ailing oscillators so that the attempt has to be regarded as a failure.
Friday's last minute action in SPX and VIX, strongly suggests that the market has run out of steam -- at least temporarily -- and needs to pull-back before it can attempt to move higher.
FREE TRIAL SUBSCRIPTON
If precision in market timing for all time framesis something that you find important, you should
Consider taking a trial subscription to my service. It is free, and you will have four weeks to evaluate its worth. It embodies many years of research with the eventual goal of understanding as perfectly as possible how the market functions. I believe that I have achieved this goal.
For a FREE 4-week trial, Send an email to: ajg@cybertrails.com
For further subscription options, payment plans, and for important general information, I encourage
you to visit my website at www.marketurningpoints.com. It contains summaries of my background, my
investment and trading strategies, and my unique method of intra-day communication with
subscribers. I have also started an archive of former newsletters so that you can not only evaluate past performance, but also be aware of the increasing accuracy of forecasts.
Disclaimer - The above comments about the financial markets are based purely on what I consider to be sound technical analysis principles uncompromised by fundamental considerations. They represent my own opinion and are not meant to be construed as trading or investment advice, but are offered as an analytical point of view which might be of interest to those who follow stock market cycles and technical analysis.
Andre Gratian Archive |
© 2005-2022 http://www.MarketOracle.co.uk - The Market Oracle is a FREE Daily Financial Markets Analysis & Forecasting online publication.


