


Will the Least Loved Stocks Bull Market Throw a Taper Tantrum?
Stock-Markets / Stocks Bull Market Dec 05, 2013 - 05:17 PM GMTBy: Gary_Dorsch

 It’s been dubbed the “Least Loved” Bull market in history. The US-stock market rally is now 57-months old, and over this time period, the S&P-500 index has climbed a “wall of worry,” rising +170% from its March 9th, 2009 low, and hitting an all-time high, above the 1,800-level. But only this year, did it begin to earn the grudging respect of smaller retail investors. They’ve plowed $175-billion into equity funds so far this year, after withdrawing $750-billion in the previous six years. The “Least Loved Bull” now ranks as the fourth biggest percentage gainer in history. If it can manage to avoid a -20% swoon over the next three months, it would become only the sixth Bull market to celebrate its fifth birthday.
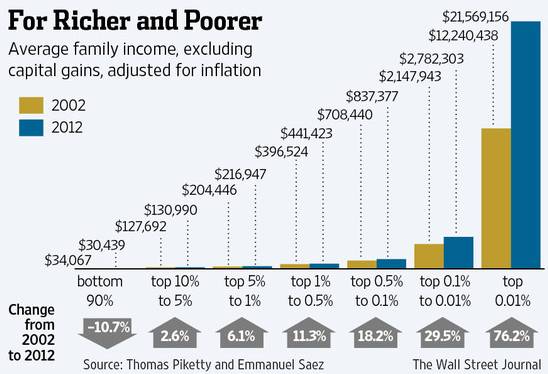
It’s managed to accomplish this impressive feat, amid the weakest US-economic recovery from a recession since the 1930’s. Since President Barack Obama took office, the pre-tax profits of Corporate America have doubled to $2-trillion per year. However, for Middle America, disposable income adjusted for inflation, has declined. The Median household income fell to $51,404 in Feb ‘13, or -5.6% lower than in June ‘09, the month the recovery technically began. The average income of the poorest 20% of households fell -8% to levels last seen in the Reagan era. Higher paying jobs lost during the “Great Recession” are being replaced by lower paying, or part-time jobs in the Obama recovery, which hurts the middle class. Hourly pay grew by just +2% /year, on average, for the past 4-years, the weakest 4-year stretch.
According to the latest data from the Census Bureau, the US has already passed the tipping point and is now officially a welfare society. Today, more Americans are receiving some form of means tested welfare than those that have full-time jobs. No, that’s not a misprint. At the end of 2011, the last year for which data are available, some 108.6-million Americans received one or more form of welfare. Meanwhile, there were just 101.7-million people with full-time jobs, including both the private and government sectors. The danger is the US has already developed a culture of dependency. No one votes to cut his own welfare benefits. Thus, the vast wealth on Wall Street hasn’t trickled down to Main Street. Instead, shareholders reaped the rewards of increased profitability, at the expense of workers.
Federal and state governments have spent a combined $5-trillion on various welfare programs over the past five years. However, that pales in comparison to the Fed’s handouts to investors on Wall Street. US-equity values have increased $14-trillion over the past 57-months. Across the Fortune-500 companies, the average chief executives pockets 204-times as much as that of their rank-and-file workers, that’s disparity is up +20% since 2009. Perversely, the compensation of the S&P-500 chieftains is often linked to the ruthless slashing of jobs and wages in order to increase the companies’ profitability. In theory, that boosts stock prices, and CEO’s collect about 90% of their compensation through the exercise of stock options.
The widening gulf between the struggling masses, and soaring corporate profits, CEO pay and the stock portfolios of the Ultra-rich - is the result of policies being carried out by central banks and their political masters around the world for the benefit of the financial elite. This year, the Fed is printing $85-billion every month to buy Treasury bills and mortgage-backed securities. Similar measures are being carried out by the Bank of Japan. The European Central Bank, and the Bank of England are keeping their lending rates pegged near zero percent to support the banking Oligarchs. This coordinated policy is intended to channel speculative funds into the stock markets, inflating share prices, while, state treasuries are saddled with even bigger debts, and leaving the working class to foot the bill.
US Stock market Tracking MZM Money Supply, - On Wall Street, the Nasdaq-100 index is +32% higher compared with a year ago, and is trading at its highest levels in 13-years years. The S&P-500 index is +27% higher, enjoying its best year since 1998, even though S&P-500 company profits are only +4.5% higher than a year ago, on average, with revenues up just +3%. Small-caps, whose fortunes are largely linked to the US-economy, outperformed the Multi-national large caps by a large margin. The Russell-2000 index soared +35%, its best year since 2003, and is trading at 75-times its 12-month trailing earnings, while the US-economy is on pace to generate growth of around +2.3% for 2013.
Furthermore, the money-minting Bull market has gone 790-days without a correction of -10% or more, – ranking as the third longest streak ever. Since 1928, there have been 94-corrections of -10% or more, occurring 322-calendar days apart, on average. Many traders suspect the Fed is clandestinely buying stock index futures on dips to enable the market to defy the law of gravity. Still, no matter how profitable, popular, or resilient – the Bull market won’t live forever. The average lifespan of a Bull market is 58-months, as in four years and ten months, which will be reached next month in early January. Of the 5 Bull markets that made it to their fifth birthdays, they posted gains of +21% in Year Five, on average.
Traders need to keep their fingers on the pulse of the aging Bull as it enters its retirement years. Nobody rings a bell to let everyone know when to run for the exits before the Bull eventually dies. However, the most common causes of death for Bull markets are well-known, such as (1) overvaluation - when stocks are selling at dangerously high price-to-earnings ratios. (2) “A can’t-lose, stocks-can-only-go-up” mentality also signals market mania and trouble ahead. Other Bull-killers include (3) the onset of economic recessions and job losses, frequently preceded by a sharp rise in interest rates. (4) Less frequent are unexpected events with shock value, known as “black swans,” like war in the Persian Gulf, which rattle investors.
Over the past few years, whenever the stock market suffered a -5% pullback, traders didn’t panic. Instead, they figured the Fed would ride to the rescue, with the “Bernanke Put,” by injecting more of the performance-enhancing and life-sustaining QE-drug. The Fed’s massive injections of liquidity – funneled into the coffers of the Wall Street banks, were a shot of adrenalin that artificially inflated the stock market, and bypassed the vast majority of Americans. There is also the invisible hand of the Fed, through intervention in the stock index futures markets that provides a safety net for the financial aristocrats.
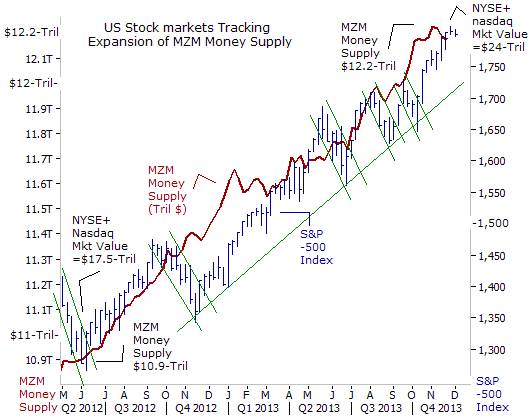
Traders began to notice the US-stock market performed better and suffered only short-lived pullbacks of -5% or slightly more, - lasting about one month from peak to trough. The stock market then took about two months to recoup its losses. While the Fed was inflating the high octane MZM Money supply +$1.3-trillion over the past 1-½ years, to as high as $12.2-trillion this week, the combined market value of NYSE and Nasdaq listed stocks increased +$6.5-trillion to an all-time high of $24-trillion. That’s a super charged beta of 5-to-1. Belatedly, the small retail investor began to recognize that the stock market is ruled by the Fed, not by fundamentals. Everyone wanted to jump on the QE bandwagon, especially after super-dove Janet Yellen was anointed as the next money printer in chief at the Fed.
The Fed has turned the rules of the game - upside down, making bad economic news a reason to buy stocks, and good economic news a reason to sell them. Good news is construed as a reason to sell stocks, if traders think the Fed might use the data as an excuse to scale down the size of its QE injections. For example, the Dow Industrials dropped -700-points in mid June, after Fed chief Ben “Bubbles” Bernanke hinted at winding down its money printing operation. In simple terms, what matters most to the stock market is the easy money flowing from the Fed, and to a lesser extent, the profits and buybacks of the listed companies.
On Nov 12th, Dallas Fed chief Richard Fisher admitted, “We’ve changed and impacted the markets because of our intervention and I understand there’s sensitivity, but markets should also bear in mind that this program cannot go on forever.” However, what matters most, is not what is actually the case, - but what traders believe is the case, and how they choose to act on that thinking. It doesn’t necessarily need to be true to matter; sometimes, it just needs to be believed by enough people. In the case of Bernanke, Yellen and Chicago Fed chief Charles Evans – the widely held belief is that their hard core addiction to QE is unshakeable, - as is the unrelenting pressure from the White House to monetize the Treasury’s debts.
Could the QE-Infinity crowd be in for a rude awakening in the weeks or months ahead? On Nov 14th, Morgan Stanley chief James Gorman told viewers of CNBC, “Everyone has had ample warning that the Fed is going to taper quantitative easing (QE). And the markets can expect to see it happen in the next couple of months,” he warned. Expectations that the Fed would scale down QE has already rocked the G-7 government bond markets and the precious metals this year. The yield on the US Treasury’s 10-year note has surged +120-basis points (bps) higher compared with a year ago, to 2.85% today. In turn, Treasury bond yields in Australia, Canada, and England also climbed higher, mostly in lockstep, while the price of Gold has tumbled -29% and Silver fell -44% from a year ago, based upon fears of a “Taper Tantrum.”
Taper Tantrum could begin on Dec 19th, - “If it hadn’t been for the debt ceiling debacle and government shutdown, the Fed would have tapered already. I would expect it definitely in the first half of next year,” Gorman told CNBC. “We know we’re going to have tapering. We know we’re living in an artificial state of excess liquidity right now. If someone is surprised by this over the next couple of months - and it will occur over the next couple of months - then shame on them. There’s been plenty of warning here,” Gorman warned. He believes it’s best for economies to be allowed to stand on their own and “demonstrate they truly are recovering,” and for tapering to happen. “It’s a good outcome,” he argued. Stated by the chief of a Treasury bond dealer, - it’s wise to heed Mr Gorman’s warnings.
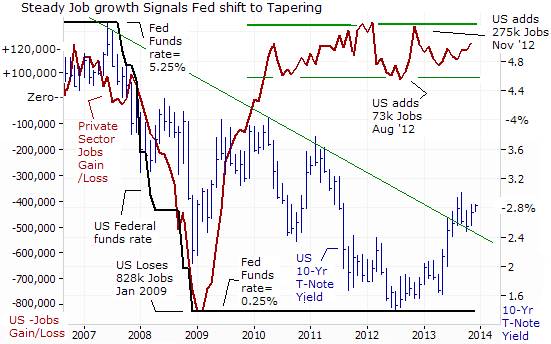
The Bernanke Fed might decide to pull the trigger on “Tapering,” as early as the Dec 18th – 19th meeting, now that it has ample evidence of a labor market that is steadily generating 180,000-jobs per month. A private survey by payroll processor ADP said on Dec 4th that companies and small businesses added 215,000 jobs in November. And ADP said private employers added 184,000 jobs in October, much stronger than its initial estimate of 130,000. Last month, Labor Department apparatchiks said public and private employers added an average of 202,000 jobs a month from August through October. That was up from of 146,000 from May through June. As such, the Fed could soon begin to unwind QE-3.
Perversely, the US-jobless rate could fall substantially early next year as belt-tightening in Washington throws 1.3-million long-term unemployed Americans off the benefit rolls. The loss of benefits would mean these workers are longer considered to be part of the labor force. As such, economists estimate this could lower the jobless rate as much as half a percent to 6.8%, and bringing the Fed closer to its self imposed threshold of 6.5%, that it said could trigger a hike in the overnight federal funds rate. Of course, the Fed can always move the goal posts to accommodate the wishes of the White House and the Richest-1% of investors.
With QE, Fundamentals are Useless - Earlier this year, the Vanguard mutual fund company - correctly ascertained that traditional measures of analysis, such as corporate earnings, profit margins, and a country’s economic growth rate, etc, – had become largely useless when it comes to forecasting stock market trends. “The problem is that there are many other factors that are influencing stocks We find that many commonly cited signals have had very weak and erratic correlations with actual subsequent returns, even at long investment horizons. In particular, Vanguard warned, “A country’s GDP growth is very different from its stock market outlook. We cannot emphasize that enough,” the report stated.
For stock market Bulls, a slow but steady growing US-economy, at slightly less than +2%, is the “sweet spot.’ It’s enough to strengthen demand for Tiffany bags and Ferraris and fine wines and Nasdaq shares, but the “trickle down” effect is too small to prod the Fed to start tapering its $85-billion per month of money injections. More so, the Bulls say the Fed can never taper and hedging bullish positions is just foolish. For the Bears, QE simply serves to underscore that Fed policy is built on the quicksand of leverage.
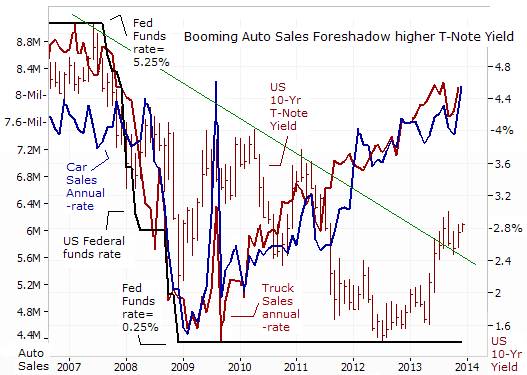
While traders don’t trust the accuracy of the labor market statistics, which are fudged for political purposes, it’s pretty tough to dispute the rosy reports coming from the big-ticket auto industry. Major auto-makers reported their best month of sales in 6-½-years in November at an annual pace of 16.4-million vehicles. Buyers are obtaining bigger loans with pay-back terms as long as 10-years. Lenders are offering lower interest rates and accepting sub-prime borrowers with weaker credit ratings. The average loan on a new car was $26,719 in the third quarter, the most in five years, with an average interest rate of 4.27%.
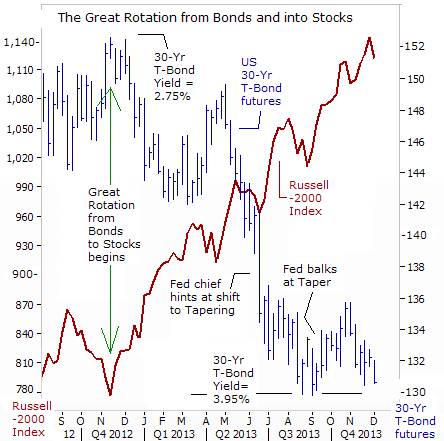
The “Great Rotation” from Bonds and into Stocks - The “Least Loved” Bull market has also been the most resilient since 1987, as it’s been able to laugh off a stunning -15% slide in the market value of the US Treasury’s long-bond, which has lifted the 30-year yield to as high as 3.90% this week, - up from 2.75% in Nov ’12. Meanwhile, the value of the Russell-2000 index has soared +64% over the past 13-months. The “Great Rotation” from bonds and into stocks has also morphed into a “Dangerous Divergence” with the ratio between the Russell-2000 index and the T-bond market soaring into the stratosphere.
“QE Infinity” has distorted the prices of stocks and bonds so wildly that nobody really knows where the markets would be priced at, in the absence of Fed bond-buying. It’s also not clear whether stock prices, are on a tear because of optimistic outlooks for future profitability, or whether the stampede into equities is linked to a massive loss of confidence in paper money that causing a shift out of fixed income bonds and into “real assets” such as equities that are buoyed by leveraged share buybacks and increasing dividends.
Pimco’s Bond chief Bill Gross wrote on Nov 3rd, that many investors are showing “more signs of desperation rather than logical thinking” as they play the QE and yen carry trade game. “Investors are all playing the same dangerous game that depends on a near perpetual policy of cheap financing and artificially low interest rates in a desperate gamble. The Fed, the BoJ, the ECB and the Bank of England are setting the tone for global markets, basically telling investors that they have no alternative than to invest in riskier assets or to lever high quality assets.” Yet, “Deep in the bowels of central banks research staff must lay the fear that Dow 16,000 stock prices will slowly lose momentum after the real economy fails to reach orbit, even with zero-bound yields and QE,” Gross warned.
By delaying the exit from QE-3, the Fed has given investors in fixed income bonds a chance to shorten the durations of their portfolios. However, on October 10th, the World Bank President Jim Yong Kim sent a dire warning, “We want to send the clearest possible message. Emerging markets have a two or three months window before the Fed starts scaling back its $85 billion in monthly bond purchases.” Kim said central banks worldwide are in “new territory,” and any withdrawal of stimulus needs to be gradual.
At some stage the political lackeys at the Fed will take their first baby step at tapering. Most worrisome is the profound weakness in the US T-bond market. If the lows of September are broken, - as expected, from a strictly technical perspective, another sharp downward spiral could lie ahead, lifting 10-year yields about �bps to +100-bps higher. Even the Fed’s pledge to hold the fed funds rate at 0.25% won’t be able to stop the carnage in T-bonds. China’s central bank might unload some its vast holdings of US T-Bonds, while the US-dollar sinks below 6-yuan. If correct, a secondary “Taper Tantrum” in the T-bond market might be the catalyst that triggers a mild -5% pullback for the “Least Loved” Bull market. It would be the 18th pullback since March 2009. What about a deeper -10% correction? They occur about 322-days apart on average. Since the last correction ended 790-days ago, one is obviously overdue.
This article is just the Tip of the Iceberg of what’s available in the Global Money Trends newsletter. Global Money Trends filters important news and information into (1) bullet-point, easy to understand reports, (2) featuring “Inter-Market Technical Analysis,” with lots of charts displaying the dynamic inter-relationships between foreign currencies, commodities, interest rates, and the stock markets from a dozen key countries around the world, (3) charts of key economic statistics of foreign countries that move markets.
Subscribers can also listen to bi-weekly Audio Broadcasts, posted Monday and Wednesday evenings, with the latest news and analysis on global markets. To order a subscription to Global Money Trends, click on the hyperlink below,
http://www.sirchartsalot.com/newsletters.php
or call 561-391- 8008, to order, Sunday thru Thursday, 9-am to 9-pm EST, and on Friday 9-am to 5-pm.
This article may be re-printed on other internet sites for public viewing, with links to:
http://www.sirchartsalot.com/newsletters.php
Copyright © 2005-2013 SirChartsAlot, Inc. All rights reserved.
Disclaimer: SirChartsAlot.com's analysis and insights are based upon data gathered by it from various sources believed to be reliable, complete and accurate. However, no guarantee is made by SirChartsAlot.com as to the reliability, completeness and accuracy of the data so analyzed. SirChartsAlot.com is in the business of gathering information, analyzing it and disseminating the analysis for informational and educational purposes only. SirChartsAlot.com attempts to analyze trends, not make recommendations. All statements and expressions are the opinion of SirChartsAlot.com and are not meant to be investment advice or solicitation or recommendation to establish market positions. Our opinions are subject to change without notice. SirChartsAlot.com strongly advises readers to conduct thorough research relevant to decisions and verify facts from various independent sources.
Gary Dorsch Archive |
© 2005-2022 http://www.MarketOracle.co.uk - The Market Oracle is a FREE Daily Financial Markets Analysis & Forecasting online publication.