


Stock Market Christmas Rally Starts Monday! - ETF Trading Strategies
Stock-Markets / Stock Markets 2013 Dec 08, 2013 - 01:45 PM GMTBy: Chris_Vermeulen

 Tis the Season for the most powerful seasonality trade of the year!
Seasonal ETF Trading StrategiesWith the stock market up big in 2013 and most participants are speculating on a pullback in the next week or two, I have to say I am on the other side of that bet. Being a technical trader I focus on patterns, statistics and probabilities to power my ETF trading strategies. So with 37 years of stats the seasonality chart of the S&P 500 index paints a clear picture of what is likely to happen in December.
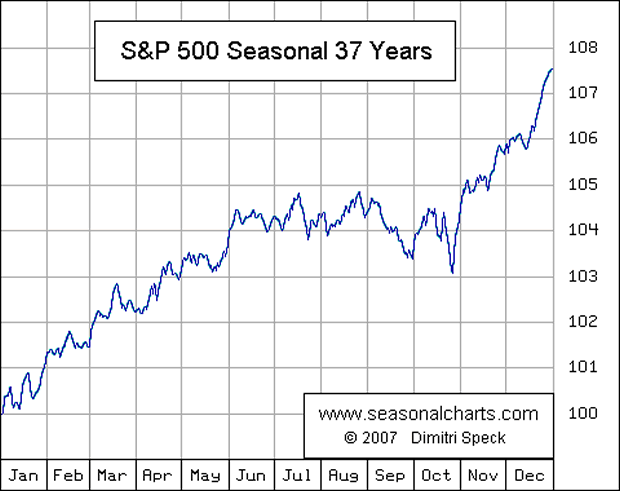
If you do not know how to read a seasonality chart, I will explain as its very simple. The simply shows what the index has done on average through each month over the past 37 years. December typically has the strongest up trend and probability of happening any other time of the year.
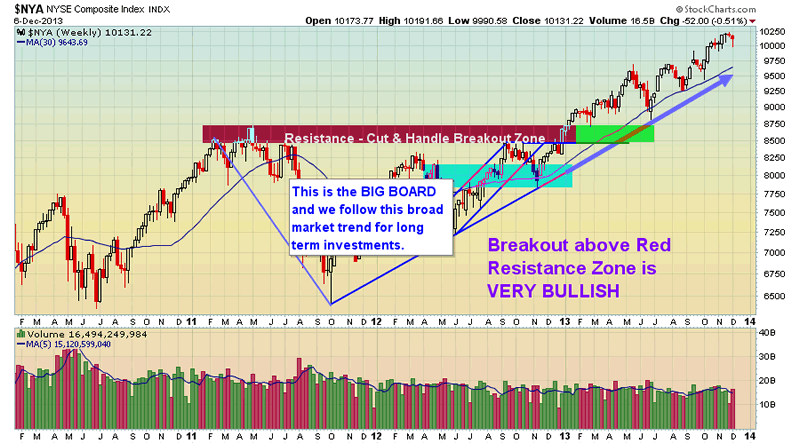
The Big Board – NYSE
The NYSE also referred to as the Big Board, is an index with the largest brand name companies. Most individuals do not follow this, but to me its as close to the holy grail of trading than anything else I know. I use many different data points from this index (momentum, order flow, trend) for my ETF trading strategies.
You must follow the trend of this index if you want to be on the right side of the market. While I follow and track the New York Stock Exchange closely and it has its own fund NYC but it’s an ETF trade I do not use. These big stocks are what really move the market (S&P 500) I think so I always trade with this index trend in mind.
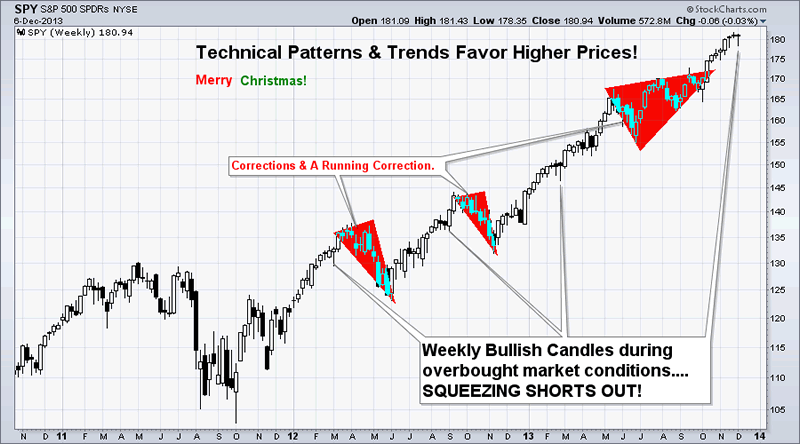
S&P 500 Weekly ETF Trading Strategy – Bullish
The chart below is self-explanatory I think… But let me recap.
The overall trend is up, so your ETF trades should be to the long side buying on the dips. The chart below goes back three years so the candles are a little condensed and small, but what you need to know are these two points:
1. After a correction within a trend, probability says that price is more likely to continue rising than it is to reverse. Notice the market just had a running correction through the summer months.
2. A reversal candle on the weekly chart (bullish reversal candle) generally indicates a 2-3 week rally is likely to happen.
Conclusion: Seasonality says higher prices, weekly chart below shows bullish reversal candle… Oya!
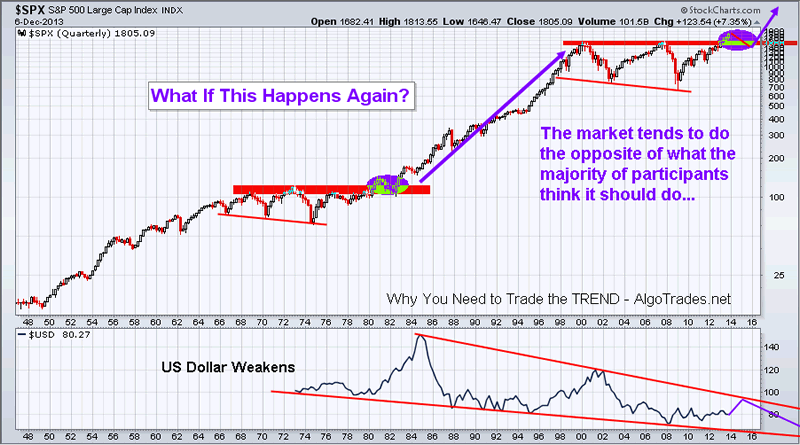
The Bigger Picture: 3 -6 Months Out…
This is a quarterly chart and BIG picture outlook. Over the next 3-6 months we could see the stock market start to become choppy and rollover into a minor bear market for a couple years. That is the best case scenario I think… The other scenario is a major crash back down to the 700-1000 level on the SP500 which would cripple the baby boomer’s from retiring and getting a job would be impossible for almost everyone – full blown recession way worse that what everyone is saying we are in now.
Things are going to be really interesting over the next few years and things for south you better be prepared to make a killing during the next bear market or life will not be fun. The nice thing is that you can take advantage of these moves without ever having to lift a finger with my automated trading system.
ETF Trading Strategies Holiday Conclusion:
In short, I think we have a couple good weeks ahead of us. Holiday season, quality family time and a rising stock market paints a nice picture in my mind.
Anyway, I hope this report was helpful and somewhat educational. I always appreciate feedback and things you would like me to write about how I interpret, trade or analyze things. I am here to help and new topics to write about are always welcome!
JOIN MY FREE ETF TRADING NEWSLETTER!
Chris Vermeulen
Please visit my website for more information. http://www.TheGoldAndOilGuy.com
Chris Vermeulen is Founder of the popular trading site TheGoldAndOilGuy.com. There he shares his highly successful, low-risk trading method. For 7 years Chris has been a leader in teaching others to skillfully trade in gold, oil, and silver in both bull and bear markets. Subscribers to his service depend on Chris' uniquely consistent investment opportunities that carry exceptionally low risk and high return.
This article is intended solely for information purposes. The opinions are those of the author only. Please conduct further research and consult your financial advisor before making any investment/trading decision. No responsibility can be accepted for losses that may result as a consequence of trading on the basis of this analysis.
Chris Vermeulen Archive |
© 2005-2022 http://www.MarketOracle.co.uk - The Market Oracle is a FREE Daily Financial Markets Analysis & Forecasting online publication.
Comments
|
Yuriy
13 Dec 13, 12:09 |
wrong tip?
Hi Chris, it loos like your suggestion that Santa rally is here has back fired. Instead of a rise, I can see 250 pips drop. How can you comment on it? |