


Crude Oil Price Three Legs Up To $100
Commodities / Crude Oil Dec 11, 2013 - 11:42 AM GMTBy: Gregor_Horvat

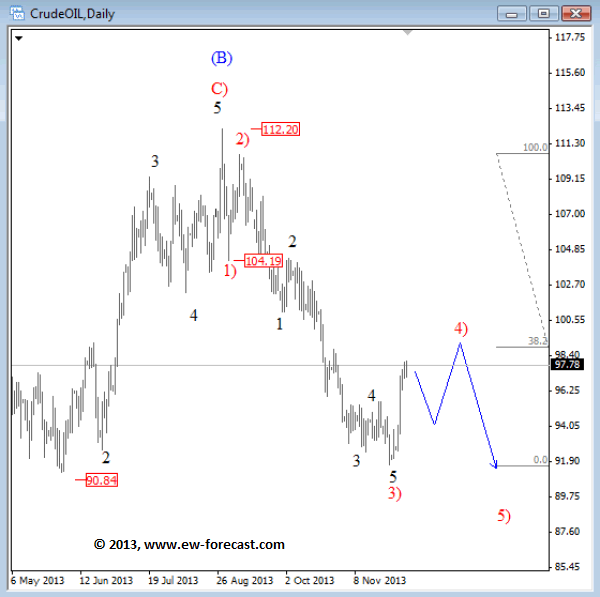
 Crude oil reversed sharply to the upside last week so it seems that five waves down completed wave 3) and that current rally is a part of a contra trend reaction. We are talking about wave 4) that could stop around 100 area, but after three legs. For now, we see only one leg from the lows so expect to see more sideways or even bullish price action during the next few days.
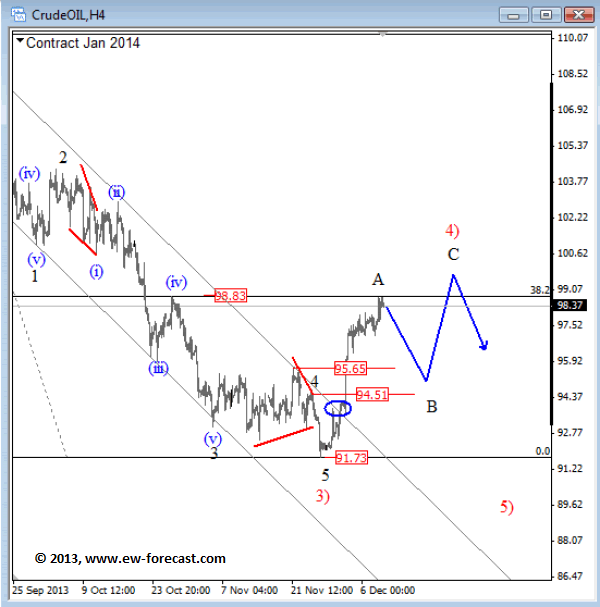
On the 4h chart we can see that sharp bounce from 91.70 and through the falling resistance line put temporary bullish price action in play. We are talking about wave 4) that should be made by minimum three legs because this is the minimum structure of a corrective price action.
At the moment we see only one leg up. This is most likely wave A, but we still expect to see waves B and C. Ideally price will turn south in the next few sessions with wave B back to 94.50-95.65 supports before going up into wave C towards 100 area as shown on the chart below.
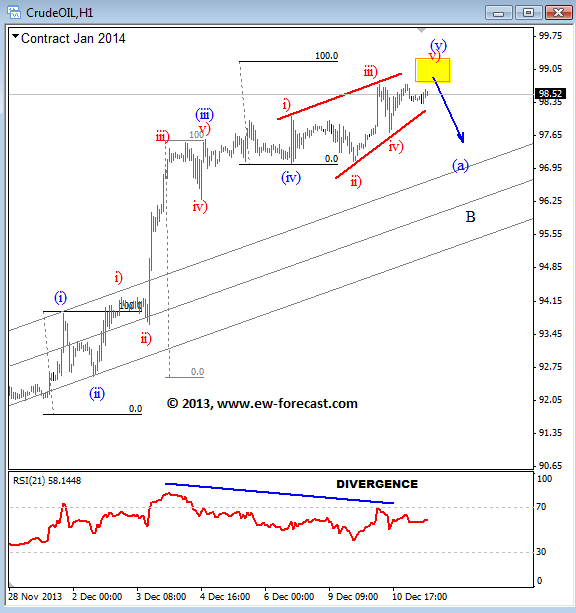
On the intraday chart we see why prices could retrace back below 96.00 in the near future. Well, we can count five waves up in black wave A, which means that trend could find resistance soon. Keep in mind that after every five waves correction follows which will be a black wave B. This black wave B could then represent a long opportunity to catch wave C up.
Written by www.ew-forecast.com | Try our 7 Days Free Trial Here
Ew-forecast.com is providing advanced technical analysis for the financial markets (Forex, Gold, Oil & S&P) with method called Elliott Wave Principle. We help traders who are interested in Elliott Wave theory to understand it correctly. We are doing our best to explain our view and bias as simple as possible with educational goal, because knowledge itself is power.
Gregor is based in Slovenia and has been in Forex market since 2003. His approach to the markets is mainly technical. He uses a lot of different methods when analyzing the markets; from candlestick patterns, MA, technical indicators etc. His specialty however is Elliott Wave Theory which could be very helpful to traders.
He was working for Capital Forex Group and TheLFB.com. His featured articles have been published in: Thestreet.com, Action forex, Forex TV, Istockanalyst, ForexFactory, Fxtraders.eu. He mostly focuses on currencies, gold, oil, and some major US indices.
© 2013 Copyright Gregor Horvat - All Rights Reserved
Disclaimer: The above is a matter of opinion provided for general information purposes only and is not intended as investment advice. Information and analysis above are derived from sources and utilising methods believed to be reliable, but we cannot accept responsibility for any losses you may incur as a result of this analysis. Individuals should consult with their personal financial advisors.
© 2005-2022 http://www.MarketOracle.co.uk - The Market Oracle is a FREE Daily Financial Markets Analysis & Forecasting online publication.