Did the U.S. Government Shutdown Help the Economy?
Stock-Markets / US Economy Dec 11, 2013 - 04:07 PM GMTBy: Frank_Holmes

 From New Delhi to San Francisco to London, and finally back in San Antonio, I’ve been communicating one consistent theme to investors: Follow the money.
What’s really important in following the money is for investors to not get caught up in the negative web spun by the media. There’s a lot of drama these days about Obamacare and Washington dysfunction. Take the government shutdown in October, when the House and Senate fought over the debt ceiling. Economic data wasn’t released, services were halted, national parks were closed, and “non-essential” government workers were told to stay home.
As a result, GDP was expected to collapse.
Yet, data released this week reveal a different, stronger image of the U.S. economy. I think Shakespeare would deem the media’s fear mongering tactics as “Much Ado About Nothing.”
Third-quarter GDP growth was recently revised to 3.6 percent, much higher than the estimated 2.8 percent figure. In November, more jobs were created and the unemployment rate fell to 7 percent. Not a spectacular result, but better than expected.
Perhaps people are gaining confidence in the U.S. economy, as figures show a buying spree in large purchases of new homes and vehicles.
In October, U.S. new home sales rebounded from a one-year low. According to Bloomberg, sales increased more than 25 percent, despite “this year’s increase in borrowing costs and property values.” As a “sign of growing momentum” for the housing market, applications for building permits also climbed to a five-year high, says Bloomberg.
Many garages will be filled with new cars and more expensive trucks and sport utility vehicles, as 16 million automobiles were sold in November, the fastest pace since February 2007, according to Autodata. American automobile makers “drove the blistering sales month,” with General Motors sales growing nearly 14 percent and Chrysler sales increasing 16 percent in November, says USA Today.
These facts support what we’ve been seeing in the U.S. purchasing manager’s index (PMI), which climbed to a ten-month high in November. Generally, PMIs are a leading indicator of future economic trends.
So, we shouldn’t hope for a government shutdown again … or should we?
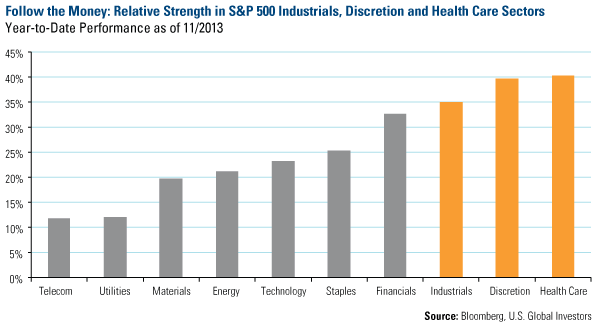
Here’s a Simple Way to Follow the Money: Look for the leaders and understand the laggards. Here’s a chart showing the top sector performance among the S&P 500 Index since January. With the revolution occurring in the health care industry, the sector has seen an incredible 40 percent increase, closely followed by consumer discretionary. Industrials stocks, which rose about 35 percent, have gotten a boost from PMI’s jumper cables.
Meanwhile, defensive areas such as telecommunications and utilities have lagged, as rising interest rates have made these defensive companies’ dividend yields less desirable.

To get an idea of the companies held in each of these sectors, the following are the largest stocks in terms of market capitalization: In industrials, General Electric (GE) is the biggest; in consumer discretionary, Amazon (AMZN) takes the lead; and in health care, it’s Johnson & Johnson (JNJ).
On a year-to-date basis, in industrials, airlines such as Delta (DAL), have taken off. Among discretionary stocks, Netflix (NFLX) is the leader, and within the health care sector, biotechnology companies, such as Celgene (CELG), have increased the most.

Ranking sectors and stocks this way, it’s easy to identify and follow the leaders. It’s like Newton’s First Law of Motion: once in motion, these stocks tend to stay in motion.
We believe the domestic bull run will also stay in motion, as the synchronized global recovery continues to take place. Just this week, Japan announced additional fiscal stimulus. In addition, China continues to grow, with sweeping economic reforms taking place, and Europe is expected to recover. Further, based on fund flows of investors selling their bonds and buying equities, we expect this trend to continue for a while. As I often say, trying to stop a bull market has risks.
Want to receive more commentaries like this one? Sign up to receive email updates from Frank Holmes and the rest of the U.S. Global Investors team, follow us on Twitter or like us on Facebook.
By Frank Holmes
CEO and Chief Investment Officer
U.S. Global Investors
U.S. Global Investors, Inc. is an investment management firm specializing in gold, natural resources, emerging markets and global infrastructure opportunities around the world. The company, headquartered in San Antonio, Texas, manages 13 no-load mutual funds in the U.S. Global Investors fund family, as well as funds for international clients.
All opinions expressed and data provided are subject to change without notice. Some of these opinions may not be appropriate to every investor.Standard deviation is a measure of the dispersion of a set of data from its mean. The more spread apart the data, the higher the deviation. Standard deviation is also known as historical volatility. All opinions expressed and data provided are subject to change without notice. Some of these opinions may not be appropriate to every investor. The S&P 500 Stock Index is a widely recognized capitalization-weighted index of 500 common stock prices in U.S. companies. The NYSE Arca Gold BUGS (Basket of Unhedged Gold Stocks) Index (HUI) is a modified equal dollar weighted index of companies involved in gold mining. The HUI Index was designed to provide significant exposure to near term movements in gold prices by including companies that do not hedge their gold production beyond 1.5 years. The MSCI Emerging Markets Index is a free float-adjusted market capitalization index that is designed to measure equity market performance in the global emerging markets. The U.S. Trade Weighted Dollar Index provides a general indication of the international value of the U.S. dollar.
Frank Holmes Archive |
© 2005-2022 http://www.MarketOracle.co.uk - The Market Oracle is a FREE Daily Financial Markets Analysis & Forecasting online publication.


