


Stock Market QE3 End Date Meaning
Stock-Markets / Stock Markets 2013 Dec 21, 2013 - 07:36 PM GMTBy: Toby_Connor

 The market gapped up on Monday, rallied to SPX 1792 in the opening minutes, then pulled back until just after the FOMC statement at 2pm on Wednesday. After that the market soared right into late Friday afternoon reaching all time new highs. For the week the SPX/DOW were +2.7%, the NDX/NAZ were +2.3%, and the DJ World gained 2.1%. Economic reports for the week were quite positive. On the uptick: the NY/Philly FED, industrial production, capacity utilization, the CPI, NAHB housing, housing starts, leading indicators, Q3 GDP, and the current accounts deficit improved. On the downtick: building permits, existing home sales, the WLEI, the M1-multiplier and weekly jobless claims increased. Next week is highlighted by Durable goods orders, the PCE and Consumer sentiment.
QUANTITATIVE EASING and the STOCK MARKET
A wild week, to say the least, and an informative one too. Prior to FED chairman Greenspan leaving in early 2006 he had implemented a plan of raising FED funds rates 25 basis points after every FOMC meeting. Then when the new chairman Bernanke took over, he continued this strategy until mid-2006 when rates topped at 5.25%. Where they remained for over one year. In June of this year chairman Bernanke suggested the FED may start tapering their unlimited $85bn/month QE 3 program when the economy improves. This week the first ‘measured’ step of tapering was announced at $10bn/month. Starting in January QE 3 will be reduced to $75bn/month. This was a very important announcement.
The plan, which was confirmed in the press conference that followed the FOMC statement, is to reduce the bond purchases by about $10bn/FOMC meeting. Placing an end date for QE 3 by late 2014. The only caveat was/is the economy needs to continue to improve. If we assume regular QE3 reductions of $10bn/FOMC meeting, the earliest the program could end is November 2014 and the latest January 2015. The importance of an end date was probably missed by most market pundits.
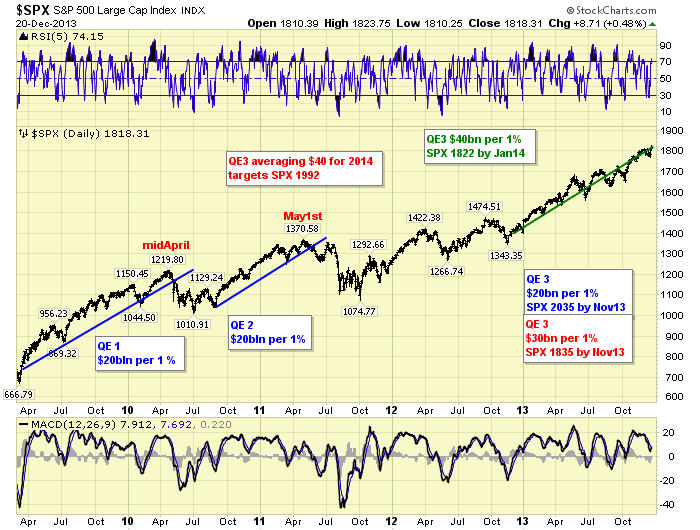
When we one reviews both QE 1 and QE 2 they uncover an interesting stock market pattern. QE 1 got going in earnest in March 2009 with a planned end date of June 2010. Notice the market topped in mid-April about two months before it ended, and then had a good correction. QE 2, which was announced in August 2010, took the market out of that correction. It had an end date of June 2011. Observe the stock market topped in early-May 2011, about one month before it ended, and then an even larger decline followed. This larger decline likely occurred because the FED opted for Operation Twist, in September 2011, instead of another outright QE type bond buying program.
Should the market follow this QE/SPX relationship, as we expect, we should now be looking for a potential bull market top between September and December of 2014. With the end date well out into next year it is no wonder the SPX rallied 41 points, (2.4%), in less that two hours after the announcement.
LONG TERM: bull market
For quite some time we had a bull market upside target around SPX 1780 by early 2014. Last month the SPX surpassed our upside target a few months ahead of time. Since then we have been awaiting additional market input before projecting another probable target. This week we received that information as noted above. Should the FED continue on the path suggested we can now project a bull market top between SPX 1965 and SPX 1992 by Q3-Q4 2014. However, keep in mind it will not unfold in a straight line. There should be a large correction at some point along the way before the top is achieved.
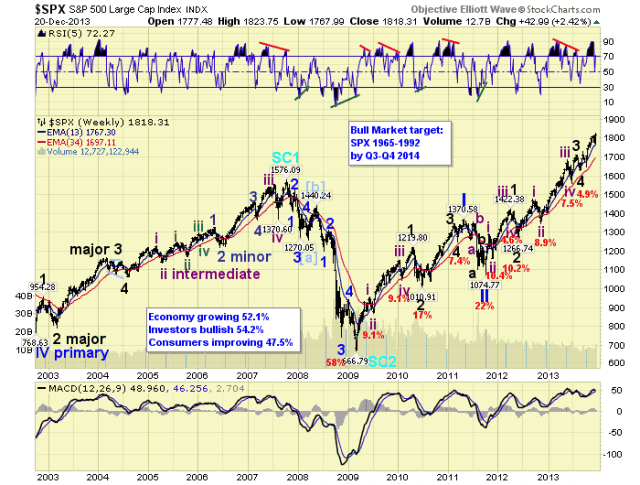
We continue to count this bull market as Cycle wave [1] of a new Super cycle bull market. Cycle wave bull markets unfold in five Primary waves. Primary waves I and I completed in 2011. Primary wave III has been underway since that low. When Primary III concludes we should witness a large Primary IV correction. The largest in over a year. Then after Primary IV concludes the market should rally to all time new highs to end Primary V and the bull market.
MEDIUM TERM: uptrend
Primary wave III has advanced from its 2011 low in five Major waves. Major waves 1 and 2 concluded by mid-2012 and Major waves 3 and 4 concluded by mid-2013. Major wave 5 has been underway since then. We have been tracking Major wave 5 in the SPX since August, and in the DOW since October, looking for signs of a completion or an extension. At the late November SPX 1814 high we labeled that high either the completion of Major wave 5 of Primary III, or the end of Intermediate wave one of Major 5. Then tracked the pullback as we awaited additional market data.
On Wednesday the market spiked down to SPX 1768 right after the Taper announcement, then recovered quite quickly closing just three points below the SPX 1814 all time high. After reviewing the charts we concluded that Intermediate wave one, of Major wave 5, had concluded at SPX 1814. And, Intermediate wave two concluded at SPX 1768. Intermediate wave three appeared to have kicked off during chairman Bernanke’s press conference.
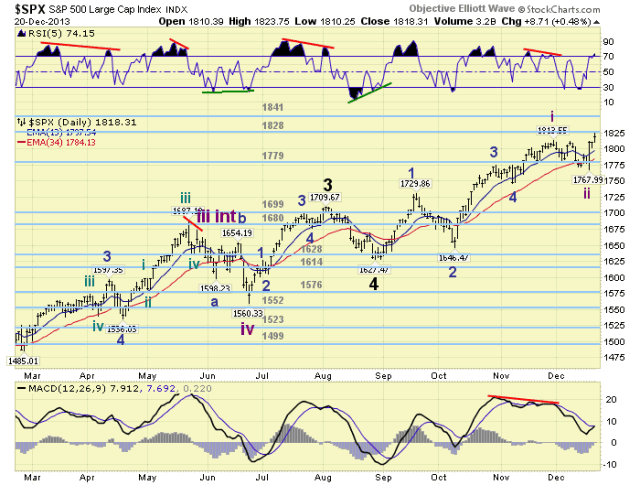
Since Intermediate wave one was quite long in the SPX, three months and 187 points (11%), we can now make some preliminary projections for the rest of Major wave 5. Keep in mind Intermediate wave one for the DOW was only one month and about 1450 points (10%). Very conservatively, at SPX 1884 Intermediate waves three through five equal 0.618 Intermediate wave one. Conservatively, at SPX 1901 Major wave 5 equals 0.618 Major wave 3. Moderately, at SPX 1955 Intermediate waves three through five equal Intermediate wave one. Aggressively, at SPX 1974 Major wave 5 equals Major wave 1. Naturally we will have a better idea for the end of Major wave 5 once Intermediate waves three and four conclude. In the mean time these are the Fibonacci relationships and generally the OEW pivots above 1869. Medium term support remains at the 1779 and 1699 pivots, with resistance at the 1828 and 1841 pivots.
SHORT TERM
Short term support is at SPX 1814 and the 1779 pivot, with resistance at the 1828 and 1841 pivots. Short term momentum declined from extremely overbought on Friday to near neutral. The short term OEW charts remain positive with the reversal level SPX 1803.
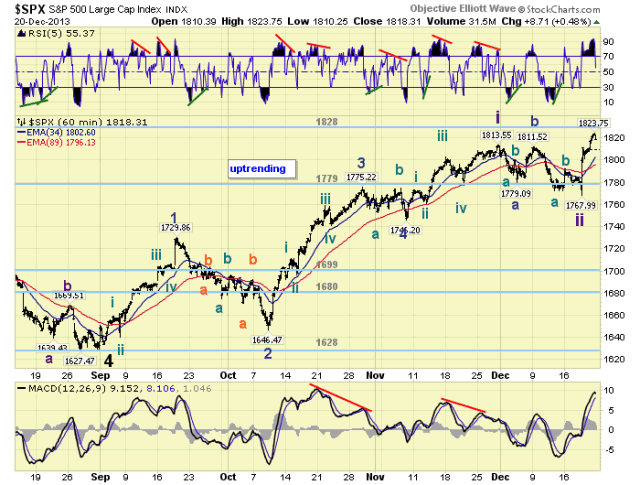
From Wednesday’s SPX 1768 low we can currently count only three waves SPX: 1811-1801-1824. This could be Minute waves i-ii-iii of Minor 1, or Minor waves 1 and 2 with Minute wave i of Minor 3. Too early to tell. Generally we have only witnessed pullbacks of greater than 13 points during Minor waves. So the former, rather than the latter, is a better fit. Looking ahead, we would expect small pullbacks until Minor 1 completes. Then a pullback in the 20 point range would fit for Minor 2.
FOREIGN MARKETS
Asian markets were mostly higher on the week for a net gain of 0.5%.
European markets were mostly sharply higher for a net gain of 2.9%.
The Commodity equity group were all higher on the week for a net gain of 2.7%.
The DJ World index is trying to uptrend again and had a gain of 2.1%.
COMMODITIES
Bonds are still downtending and lost 0.3% on the week.
Crude is still uptrending and gained 3.0% on the week.
Gold remains in a downtrend and lost 2.8% on the week.
The USD is trying to uptrend again and gained 0.6% on the week.
NEXT WEEK
Monday: Personal income/spending and PCE prices at 8:30, then Consumer sentiment at 10am. Tuesday: Durable goods orders, FHFA housing prices and New home sales. Thursday: weekly Jobless claims. Nothing on tap for the FED during this holiday week. It appears there will be only a 1/2 day of trading on Tuesday, and closed Wednesday. Thursday should be back to a full day, with probably quite a few less participants. Best to your weekend and Holidays!
CHARTS: http://stockcharts.com/public/1269446/tenpp
http://caldaroew.spaces.live.com
After about 40 years of investing in the markets one learns that the markets are constantly changing, not only in price, but in what drives the markets. In the 1960s, the Nifty Fifty were the leaders of the stock market. In the 1970s, stock selection using Technical Analysis was important, as the market stayed with a trading range for the entire decade. In the 1980s, the market finally broke out of it doldrums, as the DOW broke through 1100 in 1982, and launched the greatest bull market on record.
Sharing is an important aspect of a life. Over 100 people have joined our group, from all walks of life, covering twenty three countries across the globe. It's been the most fun I have ever had in the market. Sharing uncommon knowledge, with investors. In hope of aiding them in finding their financial independence.
Copyright © 2013 Tony Caldaro - All Rights Reserved Disclaimer: The above is a matter of opinion provided for general information purposes only and is not intended as investment advice. Information and analysis above are derived from sources and utilising methods believed to be reliable, but we cannot accept responsibility for any losses you may incur as a result of this analysis. Individuals should consult with their personal financial advisors.
Tony Caldaro Archive |
© 2005-2022 http://www.MarketOracle.co.uk - The Market Oracle is a FREE Daily Financial Markets Analysis & Forecasting online publication.