


Overbought Stock Market Inflection Point
Stock-Markets / Stock Markets 2013 Dec 23, 2013 - 12:01 PM GMTBy: Andre_Gratian

 Current Position of the Market
SPX: Very Long-term trend - The very-long-term cycles are in their down phases, and if they make their lows when expected (after this bull market is over), there will be another steep decline into late 2014. However, the severe correction of 2007-2009 may have curtailed the full downward pressure potential of the 40-yr and 120-yr cycles.
Intermediate trend - An important top formation may be in the making.
Analysis of the short-term trend is done on a daily basis with the help of hourly charts. It is an important adjunct to the analysis of daily and weekly charts which discusses the course of longer market trends.
SPX 1823 POTENTIAL INFLECTION POINT
Market Overview
In the last letter, I proposed two potential scenarios for the past week. A bearish one which would continue to pressure the market down to the next projection level, and a bullish one which would bring about a continuation of the uptrend. The issue was still in doubt by Wednesday morning, but at 2:00 EST, the Fed provided the needed catalyst to send prices higher when it announced a mild tapering program along with a promise to keep interest rates low for the foreseeable future. This rocketed the SPX 40 points in the final two hours of trading. After consolidating Thursday, the index resumed its uptrend on Friday, reaching a new all-time high of 1823 before pulling back a little over 5 points into the close.
1823 could have some importance for SPX, bringing about at least a pause in the uptrend, and perhaps more. Why? To beginning with, it's the area of a P&F target which is backed up by a Fibonacci projection. It also has some structural validity in the wave count with two possibilities, each requiring a pull-back . Finally, Friday could have been the top of a short-term cycle which may have begun a retracement into early to mid-February - although this is now less certain after SPX decisively extended its uptrend past the former high of 1813. As we will see later, 1823 is also the top of an important price channel from October 2011.
Another less than bullish point that could be made is that the move to a new high by SPX and DJIA was not confirmed by IWM, QQQ, XLF, XIV and TRAN, all of which either did not make a new high, or did so only fractionally.
From a technical standpoint, the daily MACDs of all of the above are saddled with negative divergence, although they did turn up in the past week, but if this indicator fails to pick-up some upside momentum right away, it could lead to more than near-term weakness.
Chart Analysis
Let's start with the weekly SPX chart (courtesy of QCharts, as are the next two charts).
Trying to analyze the market with different methodologies can become too complicated, and muddle up our overall perspective. So let's forget Cycles, EW, projections, etc. for a while, and look at a simple chart with simple straightforward technical analysis.
The weekly SPX is portrayed here with its bull-market channel from March 2009 (blue), its long-term channel from 10/11 (purple), its intermediate channel from 11/12 (puce green), and the short-term trend which began on 10/06/13 (aqua). The first thing we notice is that each subsequent channel and trend line rises at a steeper angle. The past six weeks have traded outside of the bull market channel and on Friday, the index made a new high and challenged the top of its long-term channel. If it continues to rise above it, it will look as if it is embarking on a long-term climactic move. Already, by trading outside of its bull channel, one could say that it has already achieved a dangerously overbought level and, at the very least, could benefit from a correction that would relieve that overbought condition and permit it to go higher.
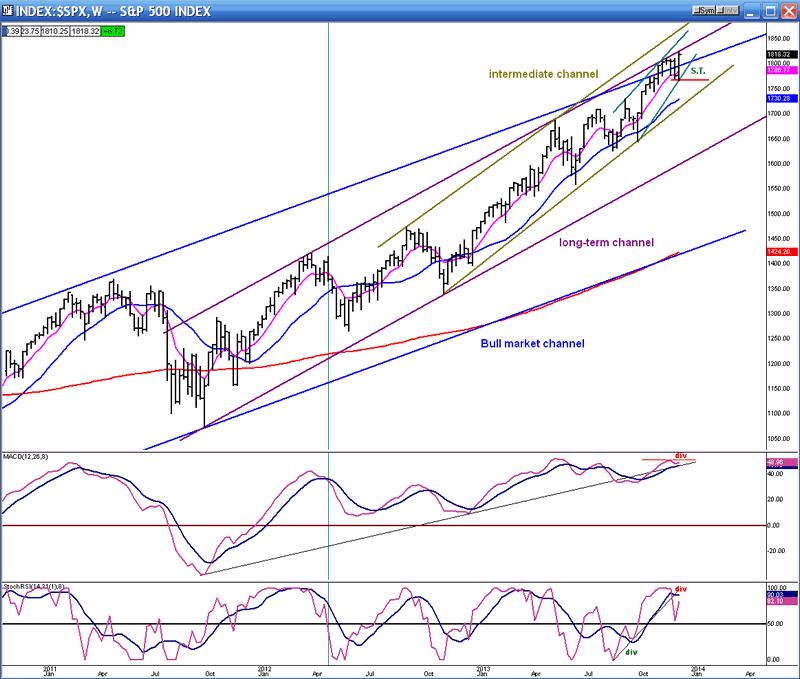
I have also added two simple oscillators at the bottom of the chart which appear to be issuing a warning. Of the two, the SRSI (lower) is the fastest and most volatile. It has already corrected toward the zero line and, with last week's new high, has moved back up but remained well below its former high, thus displaying negative divergence. The MACD is a slower and less volatile version of the SRSI which does not have any set parameters. This one is also displaying negative divergence. In fact, it is displaying double negative divergence, but the main difference with the SRSI is that its lines have not yet made a bearish cross.
The analysis of this chart can be reduced to the simplest of terms: If both indicators turn down, you can be nearly certain that the index will break its S.T. trend line, and is likely to follow suit with a break below the red horizontal support line.
I have not mentioned the moving averages, but they also deserve some consideration because they can simplify the analysis. MAs are flexible trend lines. Like trend lines, they can provide support and resistance and, when penetrated, they tell the same story. Notice on this chart how the pink moving average has consistently acted as support for the price. When the index has closed below, it has gone on to challenge the blue MA which, when penetrated, it results in a deeper correction.
Last week, when the SPX had a short-term correction, it remained above the pink MA, and then moved sharply above again. As long as it continues to respect the pink MA, we can assume that no severe correction will take place.
Let's now move to the Daily Chart. Here, we will keep the same simple method of analysis except that I have added one more dimension: that of a breadth indicator. The same channels shown on the weekly chart are also shown here with the short-term channel being more visible. I have also added some minor trend lines to identify those trends.
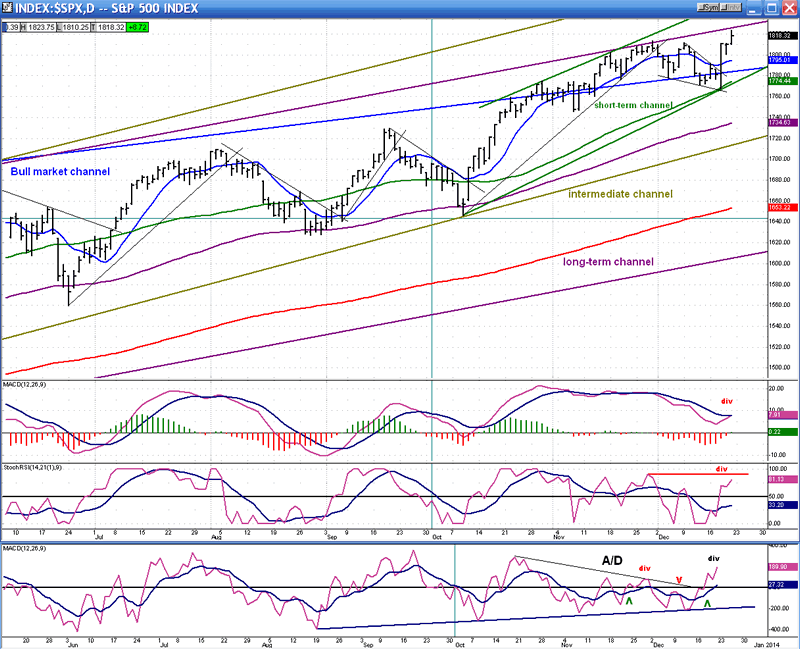
Let's see where we are overall! The SPX last touched its lower intermediate channel line on October 9, rose to the top channel line of the bull market, traded around it for about three weeks, and finally broke above, only to be stopped by the top of the long-term channel. After being pushed back the first time, the index tried again and was repulsed a second time. This resulted in a longer consolidation which ended with the Fed report last Wednesday, giving rise to another challenge to the top of the long-term channel - for the third time.
At first glance, it looks as if the third time was not a charm with some selling taking place at the end of the day. But it's too soon to tell. If the index can push through early next week, it could continue its uninterrupted uptrend. But if it cannot do so by mid-week, the odds will increase that another short-term top may have been reached.
If we turn to the oscillators, we will see why. The weakest indicator is the MACD. It has been dropping for 8 weeks and, although still positive, is getting closer and closer to the zero line. Although it just turned up with a new all-time high on the SPX, it was not a strong enough move to cause anything more than a minute bullish cross of its MAs. And, of course, the negative divergence is atrocious. This is why the SPX cannot afford to tarry at this level if it wants to continue its up-move. Even a minor pull-back risks turning the MACD back down.
The other oscillators are not in a much better fix. The SRSI and the A/D oscillator have both started an uptrend, but it's not anything to shout about and here, also, a minor pull-back in price could turn them right back down.
What the chart and the oscillators show us is a market which is overbought, at a strong resistance level, with diminishing upside momentum. That situation can easily lead to a reversal of trend(s) (plural is for different time frames).
One more chart should give us a good sense of the odds for or against the market continuing its atmospheric rise. Let's analyze the hourly chart.
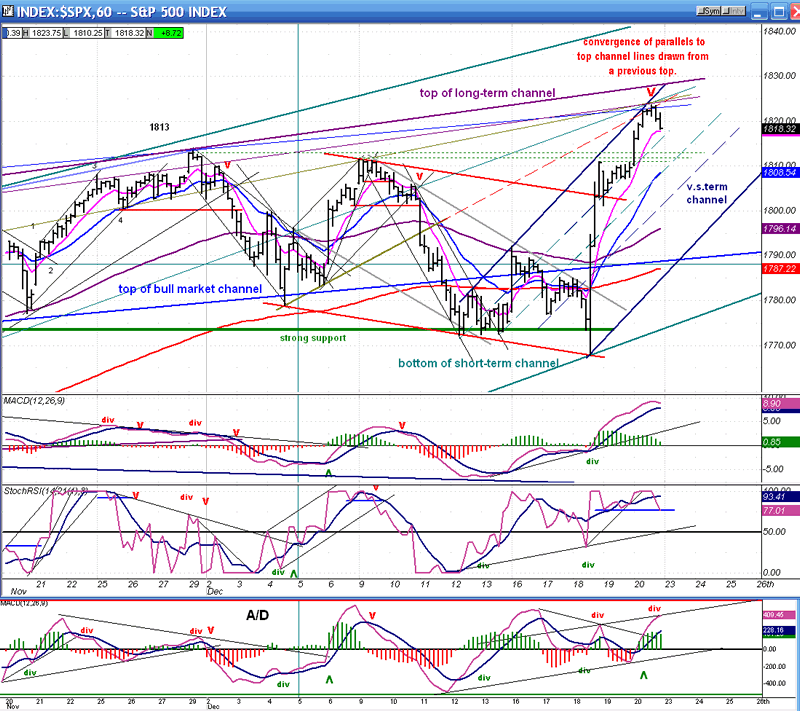
Again, the same channel lines are shown but, because of the much smaller time frame, only the top channel lines are visible in most. To the larger channels, I have added a very-short-term channel which will play an important role in this analysis, because if prices break out of it on the downside, the odds are pretty high that we have made a trend reversal. I have also added additional trend lines. The heavier trend lines represent the main channel lines. The thin lines of the same color represent parallels to those channel lines (see explanation on the chart). These are important because individually, they often form at least temporary resistance (or support) to the market trend. Here, we have 4 parallels converging at the point where the SPX peaked on Friday. This could be significant (in addition to all the other factors mentioned earlier) because 1823 (or thereabouts) could turn out to be strong resistance to any further SPX progress. Conversely, if the index can push through that level without too much trouble, it will show that exceptional strength remains in the market.
If SPX continues the pull-back which it started at 1823, it should find near-term support at the dotted lines (1810-12). This should provide a bounce if not an outright resumption of the uptrend. If it's only a bounce back up to 1823 or a little higher, it will provide the various oscillators the opportunity to develop negative divergence warning of a deeper pull-back. If SPX drops below 1796, it will be a red flag for the short and intermediate market trends.
Let's let it go at that for now and see what happens next week.
Cycles
The reversal of the 8-wk cycle was given a boost by the Fed report, but by the time SPX reached 1823, a 35-day CIT (change in trend) may have occurred. Let's see if it follows through on Monday.
The cycles which are due in February may have been weakened by the SPX making a new all-time high. We'll see! The long-term cycles due next October should continue to exert relentless downward pressure as we get closer and closer to October 2014. This should make it increasingly more difficult for the market to continue its uptrend, but severe weakness may still be averted for several more weeks.
Breadth
The McClellan Oscillator and Summation Index (courtesy of StockCharts.com) appear below.
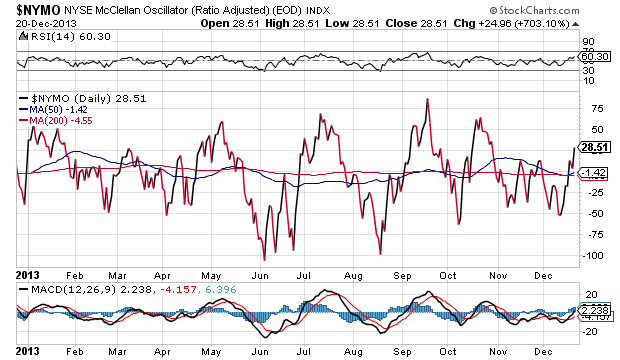
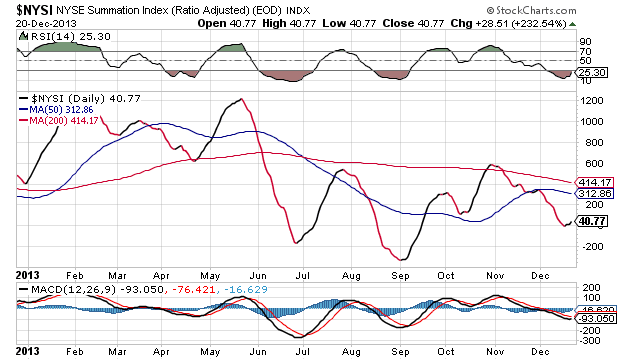
Stock markets are at record highs but breadth indicators are not -- by a long shot. The McClellan Oscillator is treading water around the zero line and the NYSI barely escaped going negative a couple of weeks ago. Price is slowly but surely losing the support of breadth. This cannot go on for much longer. Either broad scale buying comes back to the market quickly, or price will start to deteriorate as well. We should note that NYSI's RSI is oversold, a condition which does not normally pose an immediate threat to the stock market.
Sentiment Indicators
After several weeks with a reading of 70, the SentimenTrader (courtesy of same) has dropped back to 60 for the second consecutive week. This could be giving the market a little breathing room.

VIX
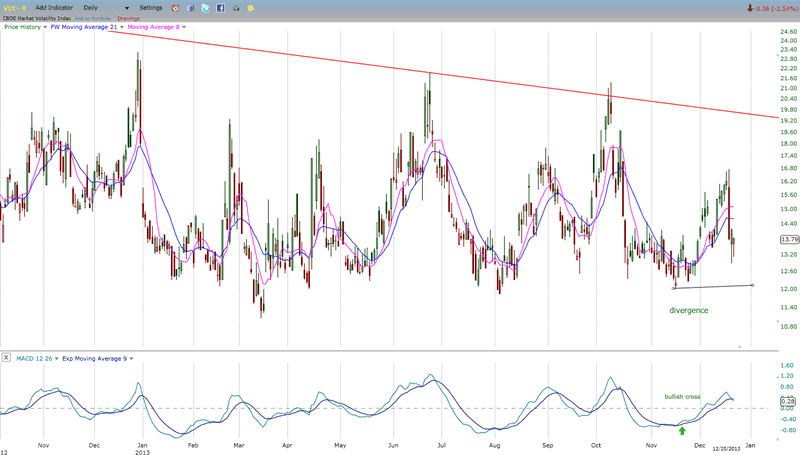
Lately, VIX has made a couple of attempts at establishing a sustained uptrend and both have failed. Note, however, that its last retracement remains well above its recent low. I consider this to be positive divergence which is a negative for the market. Like the two indicators above, it is a sign that the market has entered a danger zone, but that the danger may not be immediate.
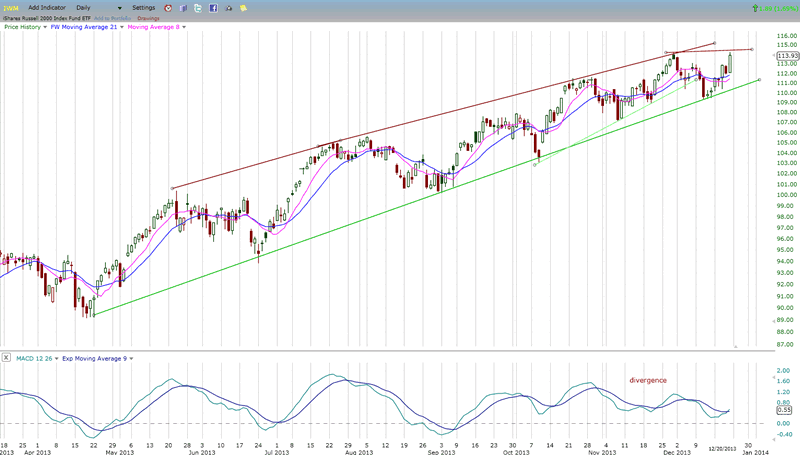
IWM (ETF for Russell 2000)
IWM is slowly losing its upside momentum. In the last market pull-back, it broke a short-term trend line but came to rest on a more important one. Last week's rally took it back to its previous top, but it could not follow the example of the SPX and go beyond,. This is a sign of relative weakness which has been a market negative in the past. Like the SPX, the MACD of IWM has slowly declined and its negative divergence to price continues to increase. Breaking below its long-term trend line and recent low would spell "reversal" for this index -- and probably for the market as well.
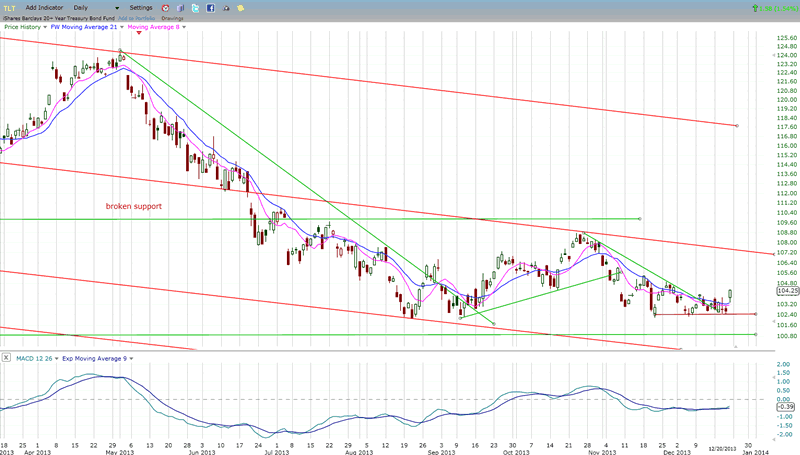
BONDS
TLT is showing some early signs of renewed life. It has successfully held at the support found at its September low and, on Friday, made an attempt at reversing its short-term trend by trading higher than at any time during the past three weeks. Let's give it a little more time to prove that this is a genuine effort at reversing its trend.
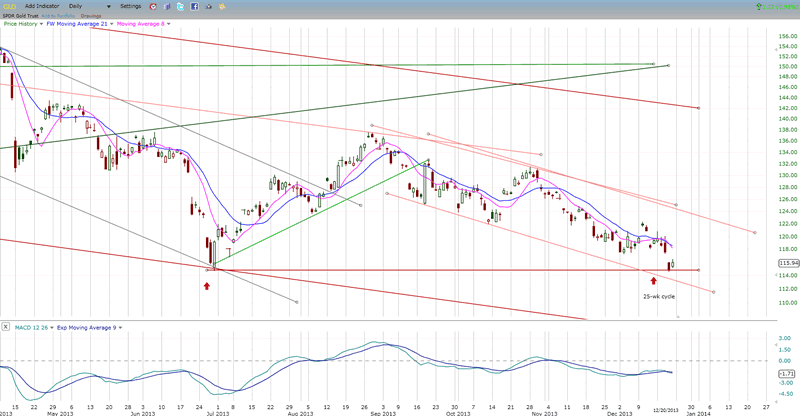
GOLD (ETF for gold)
GLD has arrived at a critical juncture. It is testing the support of the July low and trying to create a double bottom. Since it is now in the time frame of the 25-week cycle low, its chances of succeeding are pretty good, but if the cycle has not yet bottomed, it could end this move in climactic fashion by dropping a quick additional 4 or 5 points before reversing.
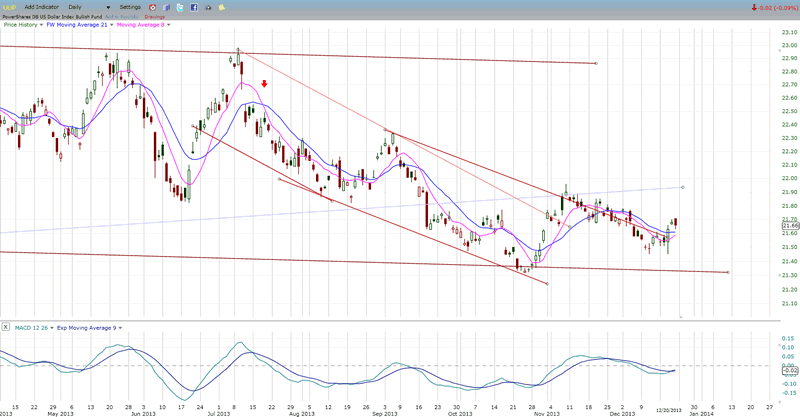
UUP (dollar ETF)
Has UUP ended its correction, and is it ready to move higher? If it has a reverse relationship to GLD's 25-week cycle, the answer has to be No! That would mean, instead, that more consolidation is ahead for this index -- which would not be surprising if the Fed sticks to the tapering program that it announced last week.
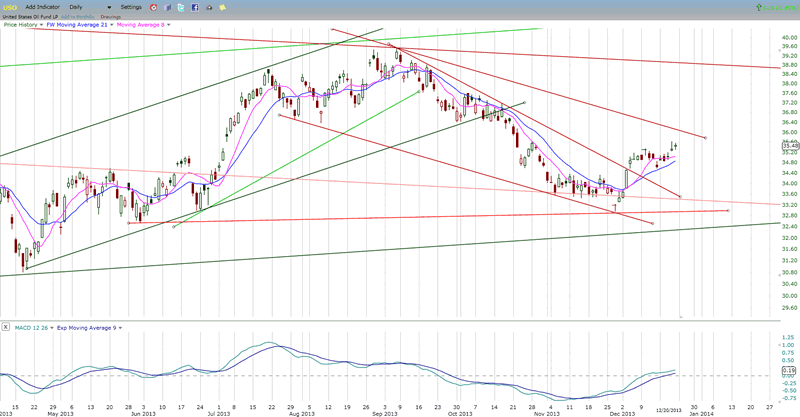
USO (United States Oil Fund)
USO has moved a little closer to the top of its correction channel. It will have to show that it is capable of going through it if its intention is to improve the uptrend started at the end of November.
Summary
SPX made a new all-time high last week. This has heightened its overbought condition and put it in an area where it could meet with enough resistance to turn it back -- at least temporarily.
Since the index has already broken above the top of its bull market channel, the onus is on the bulls to show that they still have enough strength to push it through to even higher levels and add to the climactic nature of the move.
FREE TRIAL SUBSCRIPTON
If precision in market timing for all time framesis something that you find important, you should
Consider taking a trial subscription to my service. It is free, and you will have four weeks to evaluate its worth. It embodies many years of research with the eventual goal of understanding as perfectly as possible how the market functions. I believe that I have achieved this goal.
For a FREE 4-week trial, Send an email to: ajg@cybertrails.com
For further subscription options, payment plans, and for important general information, I encourage
you to visit my website at www.marketurningpoints.com. It contains summaries of my background, my
investment and trading strategies, and my unique method of intra-day communication with
subscribers. I have also started an archive of former newsletters so that you can not only evaluate past performance, but also be aware of the increasing accuracy of forecasts.
Disclaimer - The above comments about the financial markets are based purely on what I consider to be sound technical analysis principles uncompromised by fundamental considerations. They represent my own opinion and are not meant to be construed as trading or investment advice, but are offered as an analytical point of view which might be of interest to those who follow stock market cycles and technical analysis.
Andre Gratian Archive |
© 2005-2022 http://www.MarketOracle.co.uk - The Market Oracle is a FREE Daily Financial Markets Analysis & Forecasting online publication.