Gold And Silver - In East v West Gold War, Both Are Still Winning
Commodities / Gold and Silver 2014 Jan 04, 2014 - 02:20 PM GMTBy: Michael_Noonan
 China represents the East, as its insatiable demand for buying physical gold continues unabated, while in the West, the elite's central banks have pretty much depleted their physical holdings. In the war for gold, both are still winning, but for vastly different reasons.
China and every other BRICS nation importing gold have been doing so at cheaper and cheaper price levels, as the Western central bankers have been conducting a clearance sale. Even the fixtures are being sold, like JP Morgan's fire sale of 1 Chase Plaza for $750 million, about half of its value. The building also happens to house the world's largest gold vault, and it also located across the street from the Federal Reserve gold vault. This gives China a "two-fer.". Now it can store the gold in Manhattan and save shipping costs, and should the NY central bank have any left, it just gets rolled across the underground tunnel.
The moneychangers have run their centuries old scam of storing private gold and issuing gold receipts, in exchange, making it easier for the holders of gold to carry paper, convertible into gold upon demand, instead of the physical gold itself. The moneychangers noted that the owners did not demand their gold back, preferring to keep the receipts, instead. The moneychangers began issuing receipts many times more than the actual gold backing the receipts, creating "new money" and the assumption of gold backing.
Paper alchemy was created, and it was highly profitable for the moneychangers, which became central banks. It worked quite successfully until several years ago when the elite's Ponzi scheme began to unravel. Fast forward to 2013, and the central bankers of the West are having trouble fulfilling the unprecedented demands of physical gold from the East. One thing the Rothschild formula for theft did not take into account was an opposing force greater than its fiat financial might.
China loaned Mao's gold to the NY central bank, and it would not [could not] return it The gold was gone, loaned out, sold, we will not likely know the true story, but it was gone. Paper was the name of the game for the West. Physical gold, silver, and natural resources was, and still is the name of the game for China and Russia. Both have been dumping US Treasury bonds in exchange for gold, silver, and any other asset that is not a derivative of paper. Because of the NY central bank experience, China is out for revenge.
Russia has always been a known adversary and is winning against the US by default, simply waiting for the US to self-implode, which it is doing. Where China holds the majority of physical gold, Russia holds energy trump cards over the US and its faltering scheme of the petro-dollar. It is fast being replaced by sounder forms of collateral and trade outside of the Western fiat scheme. The US has become isolated. Russia has vast amounts of natural gas to supply Europe, replacing, in part, oil.
How is the West winning in the war for gold supremacy? By default, which is all it knows how to do. The entire Western world remains in the financial grip of fiat obligations. Everything is dependent upon the central banking system that is close to collapse. The fiat Ponzi scheme is being kept afloat by China and Russia not forcing the totally insolvent Western banking system to make good on its debts. Instead, China is being rewarded by cheap gold prices and cheap New York real estate that comes with the added bonus of the largest commercial gold vault.
We have pretty much stopped announcing "gold news," as in record sales for silver and gold coins by the public, record imports of physical gold by China and other countries to a much lesser degree, disappearing gold reserves by COMEX and LBMA, how the demand for physical ounces of gold by paper holders is at its highest number ever, etc, etc, etc. All of the very valid demand side numbers that has had zero impact on the price of gold.
Most of this article is presented in generalities, on purpose. There are any number of other sites that go to great effort to present graphs, details about gold and silver depletion, the number of coins bought and sold by various countries, the number of tonnes China has imported, guesses on how much gold China owns, predictions on where the price of silver and gold will be next week, next month, pick a price, pick a time frame, they are all over the place. The graphs are presentable, the facts/figures are accurate, but the results are of no practical use and have not been for the past two years.
Despite all of this recognized demand from every possible source, how else does one otherwise account for the fact that the price of gold was down 28% for the year?
The greatest, and only impact on the price of gold has been the central bankers and their concerted effort to suppress prices, and a very successful endeavor for the past few years. In this regard, Western central bankers have been winning the paper battle on gold, but they are also losing the most important war, economic dominance.
Because the natural laws of supply and demand does not apply to gold and silver, the only way we can track the influence of endless paper supply on the market is through the most reliable source, the market itself, and the best way to track the market is through charts.
As an important aside, when we reference charts, we are not talking about traditional technical analysis that uses artificial tools like moving averages, RSI, endless broken trend lines, Bollinger Bands, whatever. Instead, we apply the most important factors that best capture market activity: price and volume.
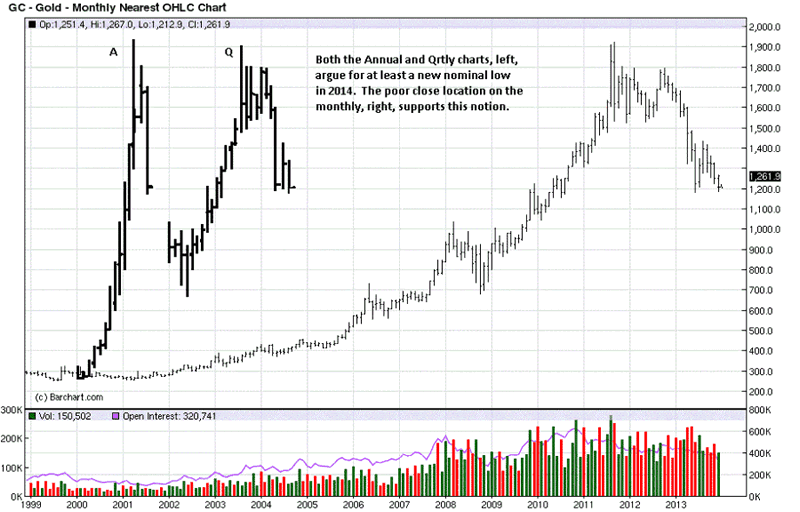
Both of the larger time frames, the Annual and Quarterly on the left side, below, suggest a lower low is more than likely. One does not have to happen, but odds favor at least a nominal lower low in 2014. The Quarterly chart looks bottom heavy for the past 3 Qtrs, and the last Qtr shows a lower high, lower low, and lower close.
The monthly chart, on the right side, shows a labored decline over the past 5 months, and the last 6 months have all been inside June's wide range. We often mention how a wide range bar will often contain subsequent bars, for whatever time frame, this one monthly. The lower end close for December also increased the probability of a lower low, next month, January.
Here are two separate forms of market activity that provide for reasonable expectations into the future, not predictions, but expectations. The wide range bar of June was the market telling us to expect price containment over the next several months, and that is what developed for the past half-year.
There was also a wide range bar in April, when a similar supply of paper contracts was dumped onto the market, just as happened in June. Price was contained for only 1 month, but the trend carried the market lower.
The second piece of market information is the location of the close on the Annual, the Quarterly, and the monthly. All indicated a higher degree of probability for a lower low in the next time period. With this information, one would know not to be in a hurry to establish a long position in futures because a lower price was likely.
It does not matter what the fundamentals say. The market is providing a clue or clues in what to expect. It may not always happen, but we are dealing in probabilities that tend to be fairly consistent.
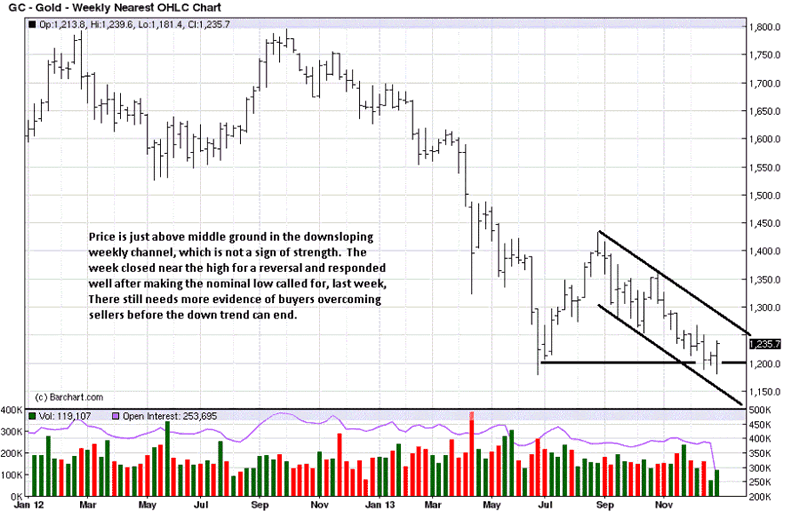
Price did make a nominal low on the weekly, and it held the support area established in June. With the close located in the middle of the down channel, while price can still rally, it is unlikely to break upside, at this juncture.
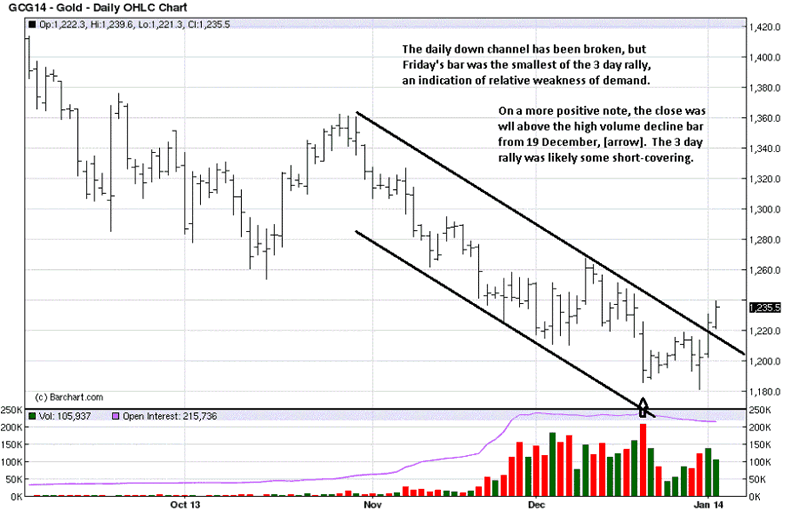
Last week, given the market structure, we said a nominal low was likely. One occurred on both the weekly and daily, but we confined our comment to the daily, [See Sharply Higher Prices? Be Careful What You Wish For, first paragraph after first chart]..
The down channel has been broken on the daily chart, but of all the time frames discussed, the higher time frames are more controlling than the daily. It could turn out that the daily activity will lead to change on the weekly, then from weekly to monthly, etc, but what we know most about market trends is that they take time to change direction.
Friday's bar was the smallest of the last three rally bars, and that tells us demand has weakened. With the location of the close near high-end on the bar, sellers were weaker than buyers. What needs to be watched closely, next week, is how price reacts on any pullback.
If the bars are wide range lower on increased volume, expect more continuation to the downside. If the bars are relatively narrow in range and volume is less, then we have a stronger indication to expect the pullback to be brief and lead to another rally attempt.
We do not have to know ahead of time, nor do we need to predict. Instead, knowing how price and volume could develop, day by day, we just need to be prepared for how price may develop, and react accordingly. The market will give us the information needed on what to expect.
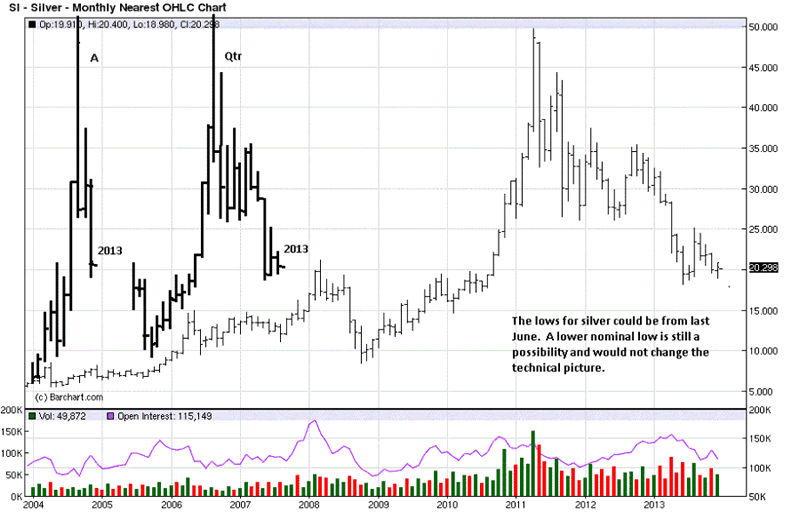
Silver is a slightly different story, according to the charts. It would not be unreasonable to expect a lower low from the annual chart. The last Quarter, 2013, was the smallest range in the past 4 years. What matters is where it appears: at the lower end of the correction. The reason why the range is small is due to lack of sellers, combined with buyers meeting the effort of sellers sufficiently to prevent the range from extending lower. It does not preclude a lower low, next Quarter, but a rally could occur first.
The monthly shows how labored the decline was relative to the wide range August rally. Here, again, we see a wide range that contained the price activity for the next several bars. December was a small range, letting us know, just like the Quarterly, selling was weak, and buyers were meeting the effort of the sellers. The buyers were able to keep the range from extending lower, and also to close just slightly above November.
The trend has not changed, but we are seeing little pieces of information that alert us to potential change.
The trend being down, and combined with bearish spacing, we know that silver has a lot of overhear resistance that will likely stop initial rally efforts from current levels. Until price moves out of the box, up or down, the TR remains intact. Last week's reversal from lows, with a strong close, did not rally much above the previous week's close. This is a small red flag that the rally could be meeting resistance.
There is a cluster of closes over the last 7 weeks. This signals either continuation lower or a reversal of the immediate trend. Until price rallies and closes above the high of the box or declines and closes under, there is no confirmation to be positioned, either way.
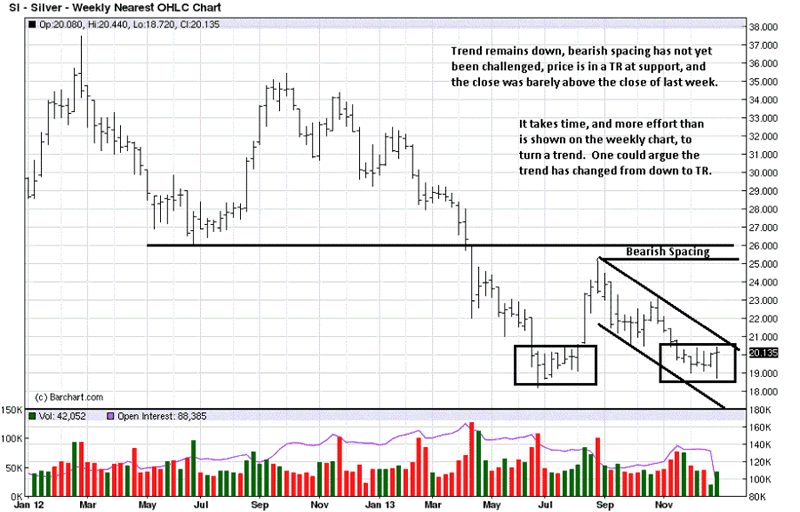
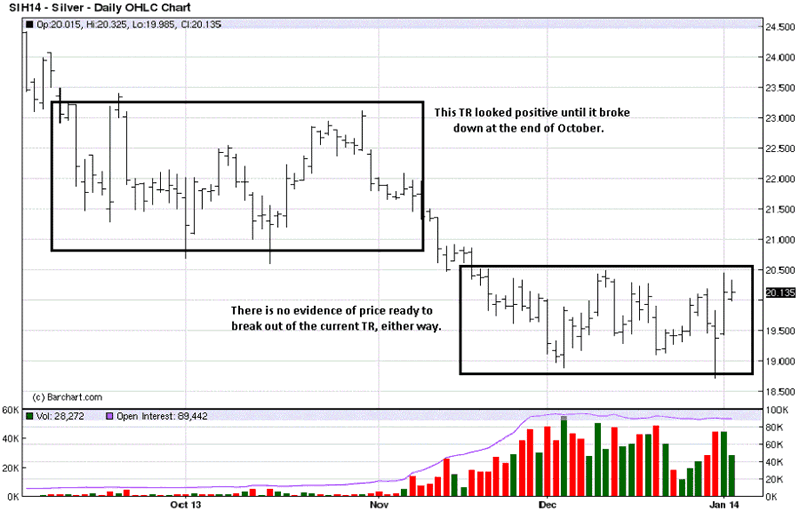
In the first box, left, it looked like price would rally higher toward the end of October. Price gapped lower, instead, and created a lower box TR, the current one. This is why we said there needs to be confirmation, even though the weekly close in the above chart "appears" as though the rally will continue. The daily chart, below,is an example of why one needs to wait and let the market be the best guide, eliminating guesswork and having to predict.
The conclusion we reach from the gold and silver charts is that price may be forming a bottom, but it will take more time before a change will take place, and that could take weeks, months, even Quarters.
By Michael Noonan
Michael Noonan, mn@edgetraderplus.com, is a Chicago-based trader with over 30 years in the business. His sole approach to analysis is derived from developing market pattern behavior, found in the form of Price, Volume, and Time, and it is generated from the best source possible, the market itself.
© 2013 Copyright Michael Noonan - All Rights Reserved Disclaimer: The above is a matter of opinion provided for general information purposes only and is not intended as investment advice. Information and analysis above are derived from sources and utilising methods believed to be reliable, but we cannot accept responsibility for any losses you may incur as a result of this analysis. Individuals should consult with their personal financial advisors.
Michael Noonan Archive |
© 2005-2022 http://www.MarketOracle.co.uk - The Market Oracle is a FREE Daily Financial Markets Analysis & Forecasting online publication.


