Stock Market Investors Get Out Now! No New Paradigm!
Stock-Markets / Stock Markets 2014 Jan 05, 2014 - 03:05 PM GMTBy: Clive_Maund

 Welcome to the New Year, and to the "New Paradigm", where stocks go up in perpetuity because, well, because they're going up, and because the Fed stands behind the market likes a towering Father Christmas ready to pump more money whenever the markets shows signs of flagging, and to maintain interest rates at zero forever. It couldn't look better, and therein lies the problem.
I'll tell you a little story. I was staying at a hotel one night in Philadelphia, en route to Ithaca, NY, after a flight from Germany, back in 2005. I couldn't sleep so I switched on the telly and browsed the channels until I came across an amusing infomercial by some dubious looking smooth talking guy going by the name of Carlton Sheets. He had a small studio audience of get rich quick wannabees assembled in a neat square seating area that reminded me of a sheep pen. He was proceeding to give them - and viewers - the benefit of his wisdom about how to make a mint out of property speculation, and was talking about the leveraged buying of entire blocks of properties. The only problem was that this was at about the time the market peaked. The naïve greedy enthusiasm of the wannabees was palpable and they worshipped the ground this guy moved over, but of course, they must have ended up being fleeced when the property market crashed soon after. I tell you this little story because this is exactly the atmosphere that we have surrounding the broad stockmarket right now - nothing can go wrong and all you have to do is load up and enjoy the ride.
We have seen this "New Paradigm" stuff over and over throughout history, but the most important thing you can learn from history is that people don't learn from history - you only have to look at China and Japan squaring up for a war over a worthless group of largely uninhabited little islands. Thus we had Professor Fisher in 1929 saying that the stockmarket would stay high for ever just before the crash, the promoters of the NASDAQ tech bubble talking the market higher just before it crashed spectacularly, the property market con artists in the mid-2000's etc. It never ends and never will until the world runs out of greedy mugs - and it never will - and now we have the stock pumpers.
Complacency is now rife. "Don't fight the Fed" is the mantra with the widespread belief that it is second only to God in its all-pervasive power. So if the Fed says it will keep rates at 0 until 2016, investors automatically believe it. The problem is that it is not the Fed that ultimately determines the level of interest rates, it is the markets. While bond holders are dull and unimaginative by nature, and have the mental agility of a Brontosaurus, even they are beginning to get fed up with the huge assumption being made by the Fed and other Central Banks that they will be prepared to put up with any amount of abuse without revolting. What is happening is that the Fed and other Central Banks are debasing their respective currencies at a torrid rate with QE and other dilution programs, so that bond holders, caught in a vice between inflation and low or zero interest rates, are bleeding capital at a rapid rate. Even factoring in that bond holders collectively are dull-witted and lethargic, there has to be a limit to the abuse that even they will tolerate. What this means is that eventually we can expect them to revolt in ever greater numbers, leading to a snowballing downward spiral in bond prices, and an accelerating ramp in interest rates, although they are now so low that it will clearly take a while for rate rises to bite. This process has already begun, with significant rate rises last year. Once they do bite, stockmarkets are likely to drop hard.
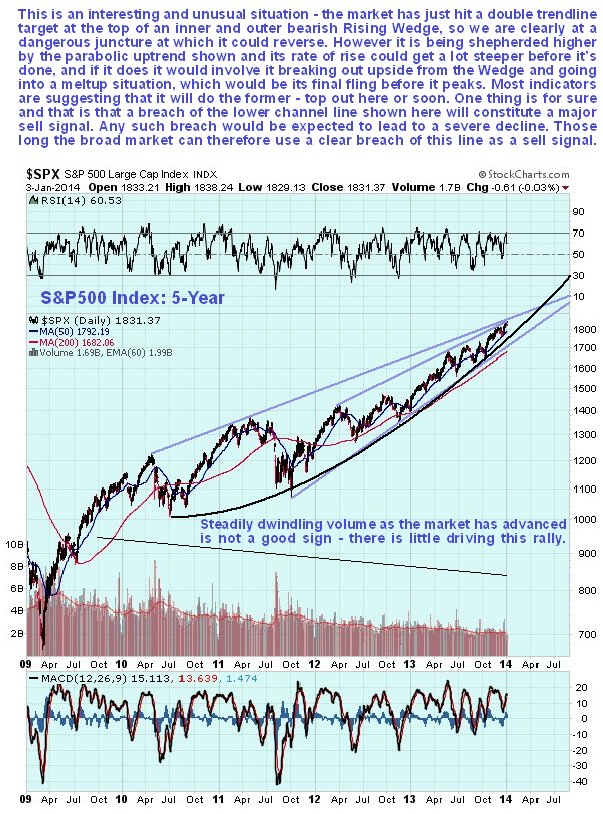
With many stockmarket sentiment indicators now at outlandish extremes as we will soon see, the situation is ripe for a "black swan" event to send markets reeling. It is hard to say what catalyst will precipitate it. It could be Thailand which is politically polarized and in danger of falling apart economically and in danger of a civil war. It might not even require a catalyst at all - all it would need is for selling to beget more selling until a self-feeding cycle of liquidation develops. Let's now look at first at the chart for the S&P500 index, and then at a range of indicators calling for, at the very least, a significant correction soon.
At first sight the 5-year chart for the S&P500 index looks as solid as a rock. The market just keeps on going up and up, climbing the proverbial "wall of worry", which is not so hard with an obliging Fed pumping like crazy in the background to keep its pals on Wall St happy, but once you start putting trend lines on the chart it starts to look a lot more risky - and that's before you take into account the many indicators that are calling for a reversal or at least a severe correction soon. The market has just hit a double trendline target at the top of both an inner and outer bearish Rising Wedge. This just by itself indicates that we are at a dangerous juncture, especially given the steadily dwindling volume as this advance has continued, which is a warning that the internals of this market are weak. On the other hand, if the parabolic uptrend in force from the mid-2010 low can succeed in forcing a breakout above the resistance of the upper trendline, we could see a final meltup move that would suck in Mom and Pop big time who would mortgage the kitchen sink to get in on the action. So let's see what happens here - we are certainly at an important juncture. Market technicals and sentiment indicators are suggesting the former outcome - that the market will not get above the upper trendline and will turn tail and drop away now, or very soon. One thing for sure and that is that you don't want to be long this market if the lower supporting trendline of the channels shown fails, as if it does the market is likely to drop like a rock.
The Smart Money - Dumb Money confidence spread is at an extraordinary extreme, and I know quite a few dummies myself who think the market is now an easy gravy train to riches and are heavily committed. They are not interested in counter arguments, and have no time for abstract things like sentiment indicators - if you challenge them they will quote things they have read or heard on Bloomberg or CNBC to support their views. You shouldn't waste your energy trying to save them - let the market teach them a lesson.
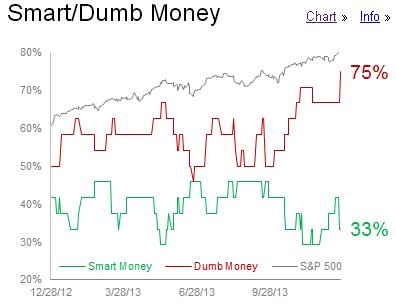
Chart courtesy of www.sentimentrader.com
As we can see on the Smart - Dumb confidence spread chart going back some years, a big gap doesn't necessary mean that the market will reverse immediately - it didn't in 2010 when the gap was high, so it needs to be used in conjunction with other indicators. However, a big gap certainly does mean that the risk of reversal is high.
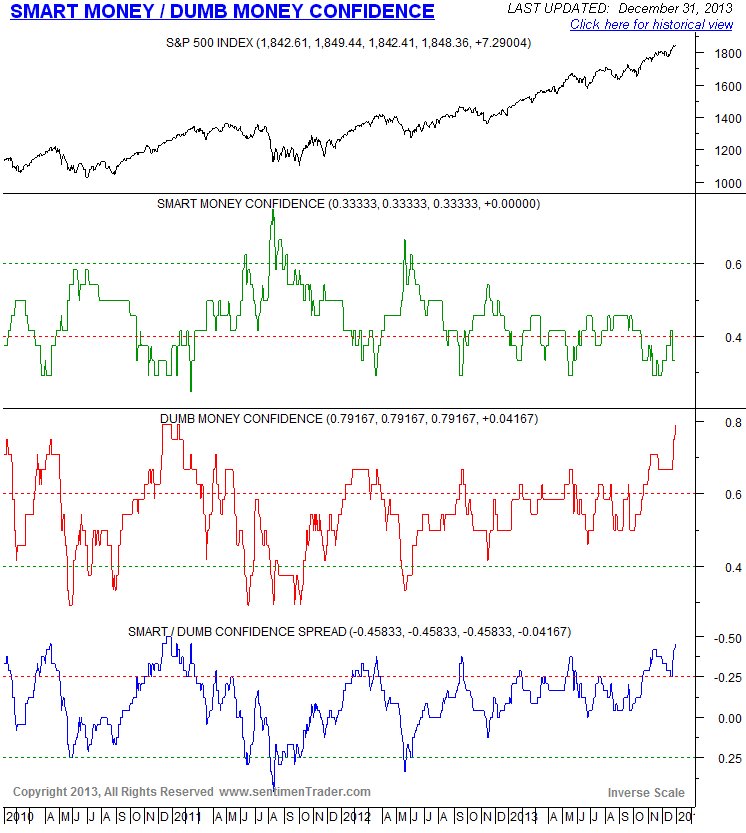
Chart courtesy of www.sentimentrader.com
The number of indicators at extremes is now getting into the stratosphere, and is screaming a warning to get out while the getting's good, especially as by getting out now you can pocket virtually all of the gains resulting from the delusional Santa Claus rally.
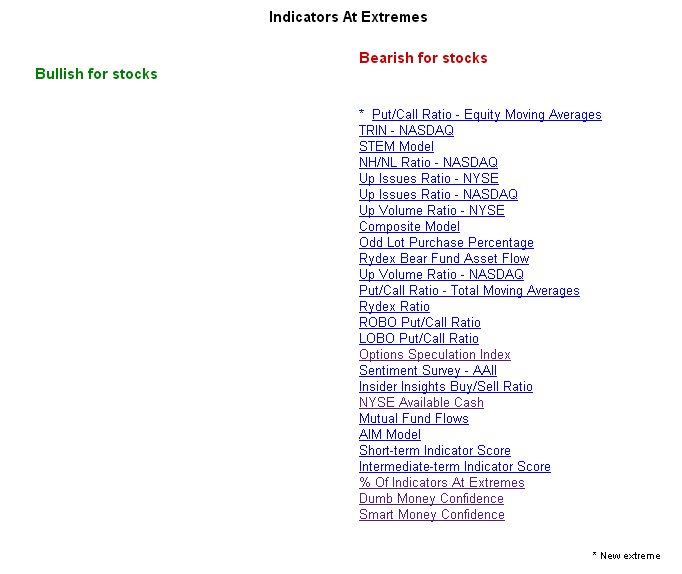
Chart courtesy of www.sentimentrader.com
The percentage of indicators at extremes is also screaming a similar warning.
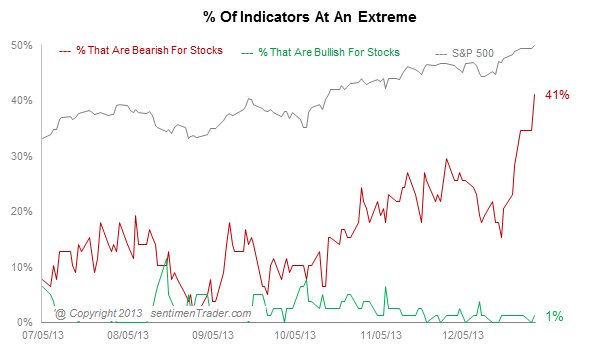
Chart courtesy of www.sentimentrader.com
The following indicator scores and groups charts paint a similar picture. These show in particular that all the cash that can go into the market is already in, although perhaps Mom and Pop can work up a little more cash to play the markets by maxing out their credit cards, and that the dumb Rydex traders are fully committed and have their heads squarely in the noose - all the market has to do now is kick away the chair and they will swing.
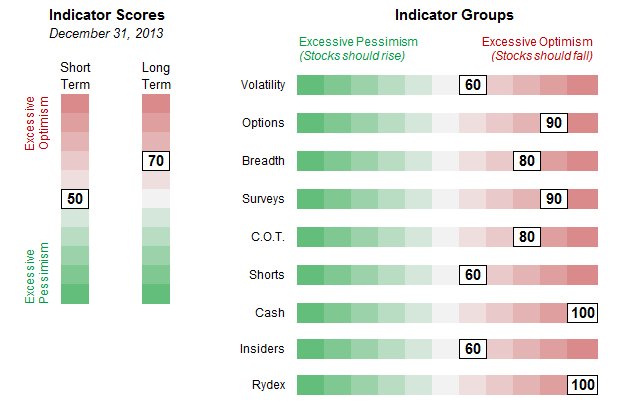
Chart courtesy of www.sentimentrader.com
The stock and sector sentiment gauges are very interesting indeed, because they show us what sectors to short, if we are so inclined. We can see that the best sectors to short are Basic Materials, Financials, Housing, and Industrials. Housing is for sure a good play for the downside, as the sector will get slammed when rate rises accelerate. On the other side of the coin the best sector of all to play on the long side, by a country mile, is the often contra-cyclical gold stock sector, which Dumb Money won't touch with a 10 foot pole. It's time to wade in and buy the better stocks across the sector heavily, and we have already started doing it.
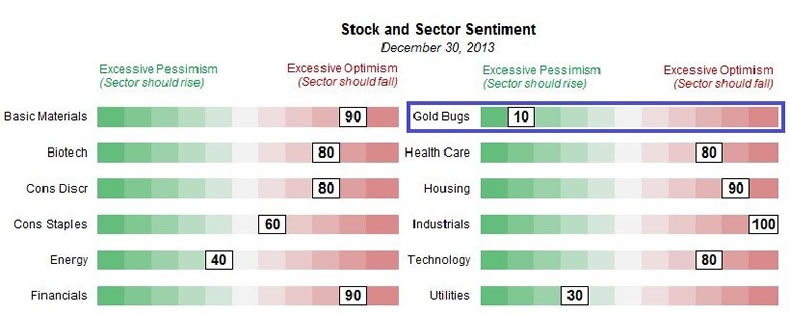
Chart courtesy of www.sentimentrader.com
The following chart gives the most graphic indication possible that the market is ripe to reverse immediately or very soon. This chart requires no explanation and you would have to be as dumb as an ox to remain staunchly bullish after examining this chart.
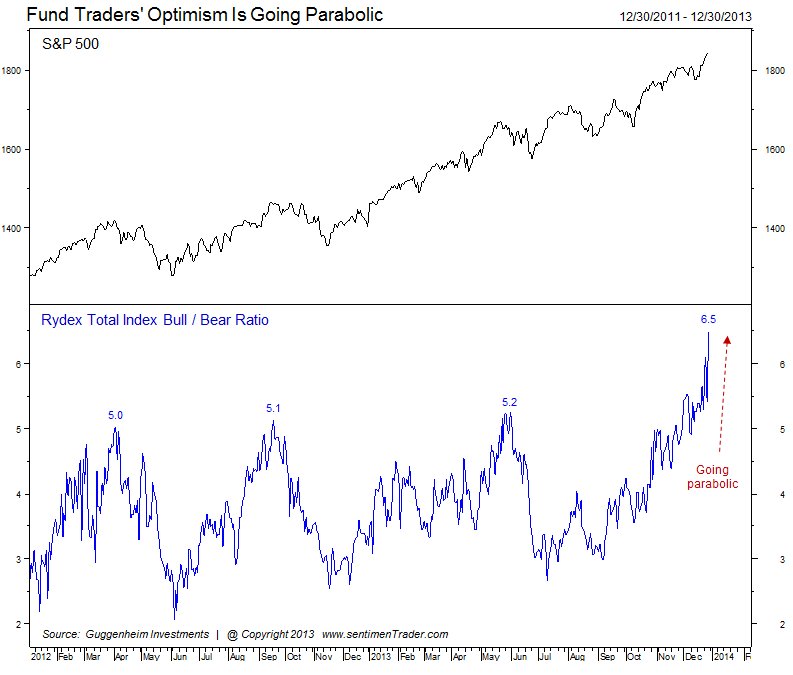
Chart courtesy of www.sentimentrader.com
Finally the NDX Commercial hedger combo chart shows that Big Money is expecting trouble - and positioned to make one helluva lot of money out of it when it finally shows up.
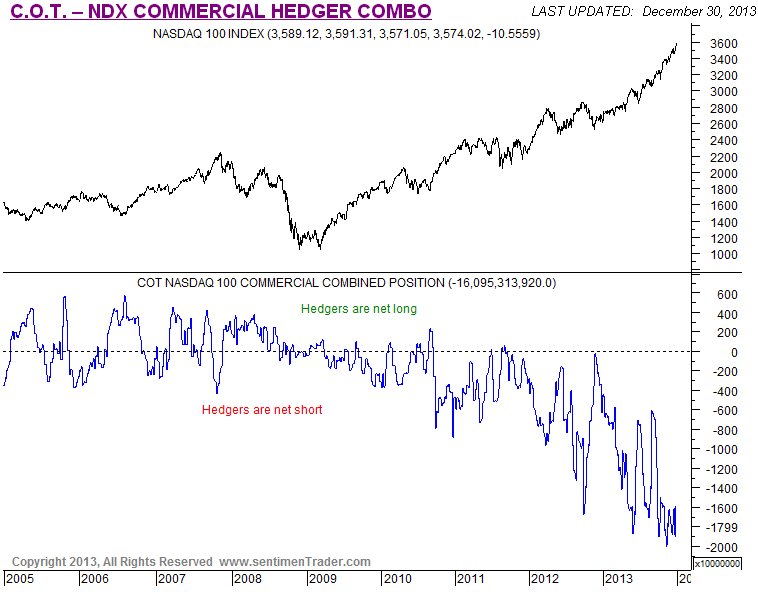
Chart courtesy of www.sentimentrader.com
Conclusion - while the possibility exists of a final vertical meltup blowoff move, investors in the broad stockmarket should maintain awareness that this bullmarket is getting "long in the tooth" after almost 5 years of gains, and that risk is at generally unacceptable extreme levels. It is considered prudent to either sell existing holdings into strength or upon clear failure of the uptrend line shown on our 5-year chart for the S&P500 index. The proceeds may be invested in the now far safer and contra-cyclical Precious Metals sector, which is viewed as being in the late stages of a bottoming process, and where there are outstanding bargains to be had.
By Clive Maund
CliveMaund.com
For billing & subscription questions: subscriptions@clivemaund.com
© 2013 Clive Maund - The above represents the opinion and analysis of Mr. Maund, based on data available to him, at the time of writing. Mr. Maunds opinions are his own, and are not a recommendation or an offer to buy or sell securities. No responsibility can be accepted for losses that may result as a consequence of trading on the basis of this analysis.
Mr. Maund is an independent analyst who receives no compensation of any kind from any groups, individuals or corporations mentioned in his reports. As trading and investing in any financial markets may involve serious risk of loss, Mr. Maund recommends that you consult with a qualified investment advisor, one licensed by appropriate regulatory agencies in your legal jurisdiction and do your own due diligence and research when making any kind of a transaction with financial ramifications.
Clive Maund Archive |
© 2005-2022 http://www.MarketOracle.co.uk - The Market Oracle is a FREE Daily Financial Markets Analysis & Forecasting online publication.