China Economy to Dictate Global Monetary Policy, Currency and Commodity Prices?
Economics / Global Economy Jan 09, 2014 - 02:22 PM GMTBy: Sam_Chee_Kong
 The recent credit crunch in China is due to PBOC’s (People's Bank Of China) or China's Central Bank refusal to act as the lender of last resort so as to help banks to get out from their financial mess. It also demonstrates that Central bank is willing to allow market forces to play a bigger role in the daily operations of the banks. This also means that banks will have to be on their own since PBOC has indicated that it will not be bailing them out anytime soon. As a result banks will have no choice but to be more conservative in their lending policies. What PBOC hope to achieve out of this?
Problem with Shadow Banking System
One reason for not intervening is to punish China’s shadow banking system which according to Fitch Ratings is equivalent to 60% of China’s GDP. Due to the strict lending practices or rather priority of bank loans given to SOEs (State Own Enterprises) there are not much funds left for the private sector. As a result they turned to the illegal or underground money lenders for their borrowings.
Due to the nature of the loans which are short on maturity and expensive in yield, it can present grave problem to China’s economy. Since the Shadow Banking System is out of its jurisdiction, it is unable to estimate the extent of the loan exposures and also the portfolio of their customers. It is estimated that many small to medium size developers are getting their finances from it and hence if the economy were to reverse, the authorities afraid the developers will start liquidating their housing stock to stay afloat. Once the selling begins and when selling begets selling, real estate prices will start to collapse.
Cracking Down on Fake Invoices
Another reason for PBOC’s tightening is to get rid of the bulk of the fake invoices coming in from Hong Kong and Taiwan. Fake invoices have always been a thorn in the flesh for the Chinese authorities. It not only reduces the Government tax collection but also helps to inflate the export figures and hence resulted in distorted trade statistics. Due to its control over the Yuan, The State Administration of Foreign Exchange (SAFE) which governs the country’s foreign exchange activities will make it very difficult for foreigners to bring money into China. The reason behind is to be able to control their movement. Say if I would like to buy an apartment in China for the price of $5 million and if I were to go through the normal channel, there will be a long wait and also I have to pay a very unfavourable exchange rate.
Hence, to bypass this procedure there is an alternative method whereby the developer can arrange for an exporter to issue me an invoice on something say car tires which I never received. Then I will send them the $5 million plus some extras for their work (commission) in money laundering. Hence I can then purchase my condominium without much hassle but my invoice will be added to the balance of trade and finally the current account in the country’s balance of payments. As a result it will help inflate the trade statistics. The following is China’s GDP growth since 2004.
As can be seen China’s GDP has been growing at the rate of about 8% per annum for the past 20 years. However the Chinese authorities found out recently that part of the GDP growth has been over-inflated due to fake invoices. To find out the extent of the fake invoice, the Chinese authorities need to cross audit its import with the exporting countries such as Taiwan and Hong Kong. Theoretically, China’s imports should be close to Taiwan and Hong Kong’s exports to China then a cross audit should reveal the size of the fake invoices. If the number of fake invoices are considerable then their national exports statistics will be way out of China’s import statistics.

How PBOC dictate our Monetary Policy?
In recent years, China has become increasingly more important to Malaysia in terms of trade. China is Malaysia’s largest import partner and at the same time provides the second largest export market for Malaysian goods. The following charts show Malaysia’s trading activity with its partners.
Malaysia Total Imports 2012 |
||
Country |
Import ($Bil) |
% Share |
China |
91.6 |
15.10% |
Singapore |
80.48 |
13.30% |
Japan |
62.39 |
10.30% |
USA |
49.09 |
8.10% |
Thailand |
36.31 |
6.00% |
Malaysia Total Exports 2012 |
||
Country |
Export ($Bil) |
% Share |
Singapore |
95.48 |
13.60% |
China |
88.75 |
12.60% |
Japan |
82.93 |
11.80% |
USA |
60.79 |
8.70% |
Thailand |
37.71 |
5.40% |
Total Trade (Imports + Exports) |
||
Country |
Imp+Exp ($Bil) |
|
China |
180.35 |
|
Singapore |
169.23 |
|
Japan |
145.32 |
|
USA |
109.88 |
|
Thailand |
74.02 |
|
The above table clearly shows that as of 2012, China is our biggest trading partner and hence we are increasingly dependent on China for trade. As a result we are redefining our monetary policy towards China’s policy direction. We have to follow China’s domestic monetary policy and its external exchange rate policy very closely. Since the Yuan is pegged to the US$ and any downturn in the dollar will also cause the Yuan to depreciate. If our exchange rate policy does not respond to the depreciation of the Yuan then it will automatically affect our exports due to our expensive Ringgit.
We are living in a globalized world and China has many trading partners supplying almost the same goods and services. Comparative advantage is almost non-existent hence price will be the main determinant for the demand and supply of the goods and services. For example in the electronics sector, Malaysia’s Carsem and Unisem are not the only Semiconductor and Test Services (SATS) players around. There are bigger and more cost-effective players like ASE and Powertech Technology from Taiwan. Thus, if the Taiwanese Government responds to China’s Yuan depreciation by doing the same to its NT dollar, then products from Taiwan will certainly have a price advantage over us. To compete we have no other choice but to follow.
The reason to follow China’s Yuan’s direction is due to the fact that there is a limitation by central banks to promote both the monetary and exchange rate policy at the same time.
Monetary policy deals with the domestic issues such as price stability, full employment and sustainable economic development.
Exchange rate policy on the other hand deals with the external sector such as sustainable balance of payment, favorable exchange rate regime and also a sustainable foreign reserve position.
As a result of globalization, the implementation of policy objective on both monetary and exchange rate has somehow been converge. For example monetary policy implementation has increasingly dependent on techniques that affect the money supply in the banking system. In trying to achieve monetary targets, central bank will either expand or contract the money supply either through open market operations, interest rate or the Statutory Deposit Ratio (SDR).
As for the exchange rate policy, Central Banks are also increasingly depending on currency intervention. Intervention is a situation where central banks use open market operations to buy and sell foreign currency so as to influence its domestic currency. However such operation will also influence the foreign reserve holdings in the country. This is because when the central bank buys foreign exchange it will need to sell its own currency and similarly when it sells foreign exchange then it will be buying its own currency.
The interrelationship between the exchange rate and monetary policy is very complex. To simplify matter, I present you the following example. Say for example Bank Negara Malaysia wishes to promote a tight monetary policy so as to take some heat off the economy. The basic policy tools available are as follows.
- Open Market Operations (OMO). By this we mean the Central Bank will sell securities in the Secondary Market to financial institutions so as to mop up the excess liquidity from the market.
- Interest rate hike. When interest rate is hiked then the cost of borrowing will increased and hence the demand for money will decrease.
- Increase the Deposit Ratio that commercial banks need to adhere to say from 5% to 10%. Thus having to set aside more funds to meet the deposit ratio, banks will have less to lend out. The fractional reserve banking system works two ways. In this case when the Central Bank increases the ratio then the ability of banks to lend is reduced by half. To calculate the point of leverage we can use the following formula.
100/Deposit Ratio, hence in this case the leverage has been reduced from 20 (100/5%) to 10 times (100/10%). In the end, banks will need to recall some of their loans from the market so as to adhere to the new Deposit Ratio.
In this case if the hike in interest rate is a policy of choice then naturally it will attract an inflow of capital from international investors which will help appreciates the Ringgit and increase our foreign exchange reserves. On the other hand the open market operations of the exchange rate policy also tend to increase or decrease the foreign exchange reserves through the buying and selling of foreign currency. When our Ringgit appreciates then our exports will be more expensive while our imports will be cheaper. Hence, this will further deteriorate our exports but at the same time increases our consumption due to the cheaper imports.
The extent of the exchange rate policy targeting depends on the size of our domestic money market. If our daily currency intervention is large relative to the size of our domestic money market then it is feasible to use it as a domestic monetary policy tool. However such operation can only be performed in an environment called unsterilized foreign exchange intervention due to the size of netting.
Malaysia’s Exchange Rate Targeting
Since China’s Yuan is pegged to the US$, PBOC does not need to intervene too much in its daily exchange rate setting and thus can concentrate more on its domestic monetary policy. Hence, PBOC can now have more leeway on its monetary policy to promote internal stability.
Malaysia on the other hand has to target its exchange rate through its managed or dirty float regime. It is very difficult to target both unless Malaysia is willing to ‘free to float’ the Ringgit or lose some sovereignty over it. This means that Malaysia will lose control over the Ringgit and its level to be determined by market forces in the short term. But we doubt Malaysia is willing to do that as with other countries such as Turkey and Brazil as they consider it is too dangerous to let the market decide the exchange rate.
So, how China is going dictate Malaysia’s Monetary Policy? The answer is size matters. Being our largest trading partner, whenever China embarked on either a loose or tight monetary policy our Bank Negara Malaysia will have to follow. As a result, how will the recent credit crunch in China going to affect Malaysia?
Declining prices in Most Commodities
Malaysia’s Credit Squeeze is a direct result of China’s monetary tightening. Malaysia’s monetary policy is closely tied to China’s due to the large extend of its trade with China. When our exports are dependent on China then naturally our domestic monetary policy will have to readjust according to the monetary conditions in China. Due to the credit crunch in China, Malaysia’s exports to China will likely to be reduced in the coming months and hence this will put pressure into commodity prices as we saw back in the financial crisis in 2008. Commodity prices then declined on the average of 40-60%.
Cost Push Inflation
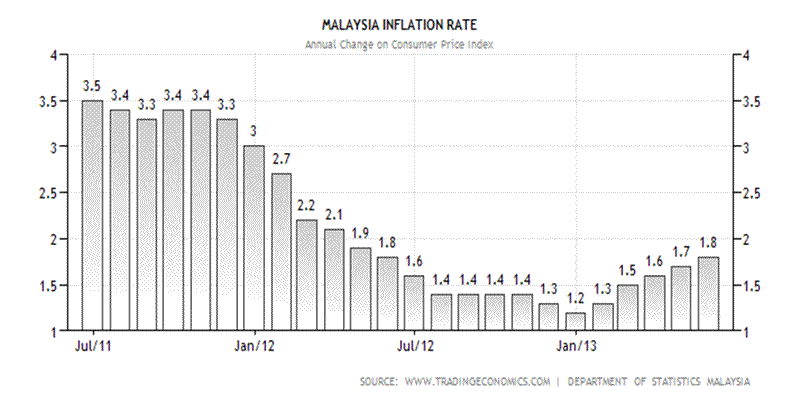
Our domestic inflation rate should also be heading higher due to increasing import prices. A lot of our manufactured products have high content of imported components and hence any increase in the import prices will have a ‘pass on effect’ on the prices of the final products.
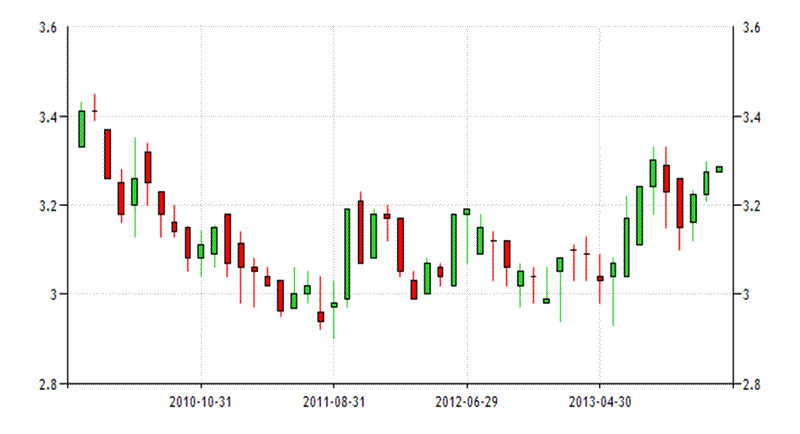
Another reason for the price hike is not due to our increase aggregate demand but our Ringgit depreciation since December 2012. On the USD/MYR chart below you can see that our ringgit was trading at 3.29 to the dollar as of this writing (05/01/2014). This represents a depreciation of about 12% to the dollar. Below is USD/MYR chart since 2010 which shows the Ringgit is now trading at a multi-year low.
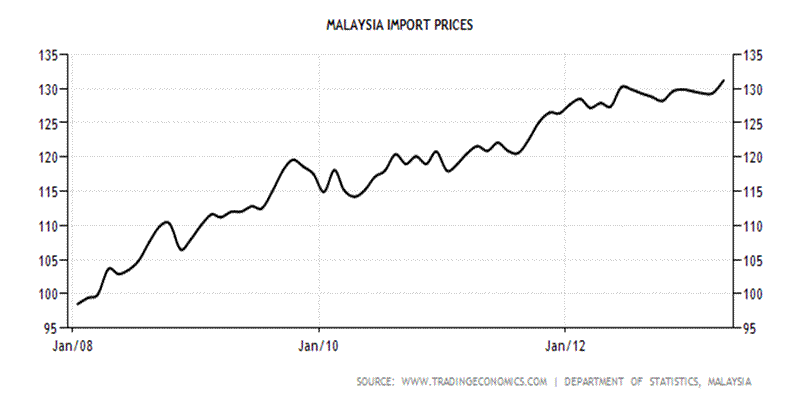
Following this, import prices has since been on the rise and reached a new high of 131.20 index points in April 2013, from 129.40 in March 2013 as shown by the following graph.
Interest Rate Hike and Economy Slowdown
Another side effect from the credit crunch is it will help push the short term interest rate up. We do not expect to see any credit easing from the government anytime soon as they are serious in reigning in the excessive credit expansion from the past. Due to the past policy on credit easing, it resulted in an explosion of household debt which has become one of the highest in the region, standing at 83% to GDP. The following chart shows Malaysia Loans to Private Sector from July 2011 to May 2013.

The month of November 2013 tops the chart with the total of MYR 130.43 billion loan out to the private which includes the household and business. Hence our Government has no choice but to put a hold on further credit easing and as a result there is less money available for loans.
The decrease in money availability led to a decreased in investment and spending as capital became more expensive to obtain. Banks which have obligations such as to make available funds for the redemption of Wealth Management products will have no choice but to borrow from the interbank market or KLIBOR (Kuala Lumpur Interbank Offer Rates) which is more expensive or through the issuance of new products. Hence, difficulty in obtaining finances through the interbank market also helped push the interbank rate higher in the short run. This limiting of access to capital also slows down economic growth as investment decreases.
Conclusion
As China is marching ahead to become the largest economy in the world by 2025 (by consensus economists), the Yuan will have to be made fully convertible before then. To aid this process, recently China has been practicing Currency Swaps with more than 40 nations including the European Central Bank. As a result the Yuan is now the second most traded currency in the world.
As can be seen from the past, without much concerted efforts from trade partners even the mighty U.S is not able to muscle through its exchange rate policy over the domestic policy objectives during the Carter Administration in the 1970s.
China’s ability to maintain the stability of the Yuan depends on the future monetary policy direction of its trading partners. China is now promoting what is called the ‘Policy Coordination’ whereby it hoped to achieve overall policy objectives with participating foreign Central Banks. By this, they will try to make major policy announcement or interventions at about the same time so as to tell the market that they are synchronizing their efforts. As of late there is evidence that China and its trading partners are synchronizing their efforts in the latest round of credit crunch.
According to the Institute of International Finance shows that the credit crunch in China is hitting harder than it is thought. It seems that not only the rest of Asia is suffering but also Latin America. The credit index which shows whether credit is easing or tightening with the 50 point level being in equilibrium. China’s current standing is 45.7 points while the rest of Asia scored 45.2 points and both are in the lowest since 2011.
Another evidence of policy coordination is the performance of the Brazilian economy which is closely following the Chinese economy.

Source : The Monetarist
As can be seen from above, PBOCs influence on the Money Supply M1 has profound effects on the Brazilian NGDP. It looks like the Brazilian NGDP follows closely with the movement of the Chinese Money Supply M1. A growth in the M1 will be followed by growth in the Brazilian NGDP. The relationship is fairly obvious because China is Brazil’s largest trading partner. Hence any monetary policy adjustment from China will have profound effect on Brazilian exports (mostly commodities as in Malaysia). As a result, the current credit crunch in China will also have profound effect on its consumption of commodities. China being the largest consumer of certain basic commodities, a decline in consumption will certainly have negative effect on its prices. Hence, I shall see a downturn in Brazilian exports and also an increase credit crunch in Brazil.
Nevertheless, I estimate that the current downturn in the Chinese economy will be short term as its primary objective of the credit crunch is to get rid of the fake invoice scandal and also to reduce the importance of the Shadow Banking System. Once these issues are settled, we should see an upturn in the Chinese economy as soon as the first quarter of 2014. Moreover as many Western analysts have predicted the implosion of the Chinese economy since 2008, I beg to be different. As of the indication of where the Chinese economy is heading, I present you the following chart which shows China’s Gross fixed capital formation.
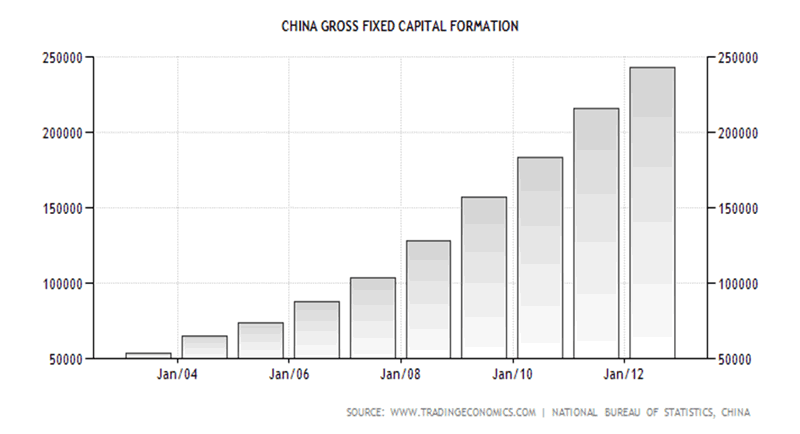
As you can see China’s gross fixed capital formation has been increasing from about 51,000 CNY in 2003 to 243151.90 CNY in 2012. So in other words there has been an almost fivefold increase in the last 9 years. Since a nation’s economic growth depends much on its fixed capital formation we are confident that the Chinese economy will be able to grow at least 7% - 8% per annum for the next 5 – 10 years. Hence, with this continued growth trajectory, the Chinese economy will be able to double in the next 9-10 years. This can be estimate by using the RULE of 72. To estimate the number of years the Chinese economy to double we use the following formula.
72/growth rate
If the Chinese economy were to grow by an average of 8% then it should be able to double in the next 9 years (72/8%).

As from above, by 2024 the size of the Chinese economy should be in the vicinity of US$16.5 trillion which sets it closer or even larger than the U.S economy (depending on its growth).
On the other hand, the U.S GDP growth has somehow slowed between 2008 and 2012 and this has enabled the Chinese economy to ‘catch up’ as shown by the chart below. The annual growth rate of the U.S GDP is estimated to be in the region of 2% in 2013.
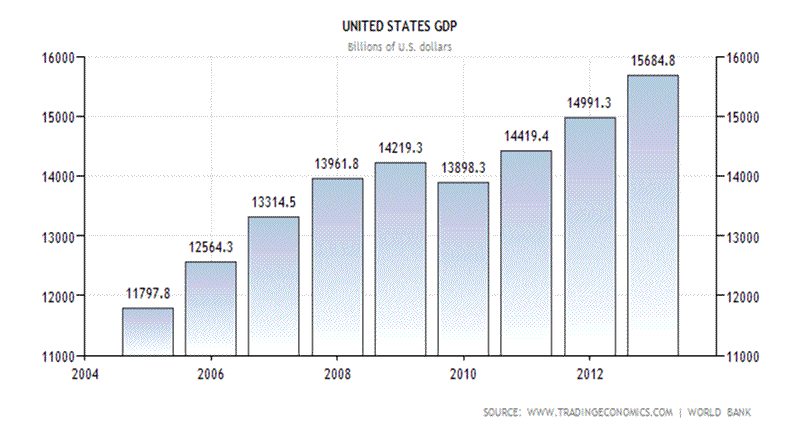
To estimate the size of the Chinese and U.S economy by 2025, we shall use the following formula.
FV = PV(1+i)ⁿ , with the following assumption.
Where,
FV = Future Value
PV = Present Value.
ⁿ = 13 years
Growth Rate = i
Present Value (U.S) – US$15.68 trillion (2012)
Present Value (China) – US$8.23 trillion (2012)
Given the above scenario, if we were to take the GDP and average growth rate in 2012 and compound it 13 years to 2025, it will produce the table below.

As can be seen, the Chinese economy should be larger than the U.S economy by then.
China’s has achieved considerable success in its economic transformation from Central Planning to Market Socialism. However with Market Socialism there is always the threat of encountering diminishing returns in growth. As such, China is starting to move towards the ‘endogenous growth model’ whereby success breeds success is the theme. China like Japan in the 1970s to 1980s has been excelling from one industry to the next. China has already been doing what it takes to create a conducive environment for the promotion of sustainable growth.
Measures to strengthen the endogenous growth such as promoting the rule of law, secure property ownership, increase investments in education and health services, and lowering of transaction costs by having prices dictated by market forces helped create a more solid foundation for its economy. As a result of proper planning and increased investment into education especially in Science and Mathematics, China now has the lowest Brain Power/Population cost in the world.
To further strengthen the economy, the law of contract has also been reviewed so as to protect trade and also allow an orderly closure of businesses (especially the SOEs) so that capital can be redirected from inefficient sectors to more productive areas such as building infrastructures in road, rail, sea and air transportation networks.
As a result the Chinese economy is able to escape the diminishing returns in growth as experienced by many developed countries. Due to the application of advance technologies and modern production techniques coupled increased capital spending, it enabled the Chinese to continuously push the production function curve upwards as shown below. Whenever the real GDP growth approaches stagnation due to the diminishing returns to capital, further growth can be achieved with increased technological advances. In a way, China’s economic growth as measured by the GDP/capita can grow unabated if the Chinese continues to invest in technology. This is because it is possible to shift the production function from Y → Y1 → Y2 → Y3 → Y4 and so on.
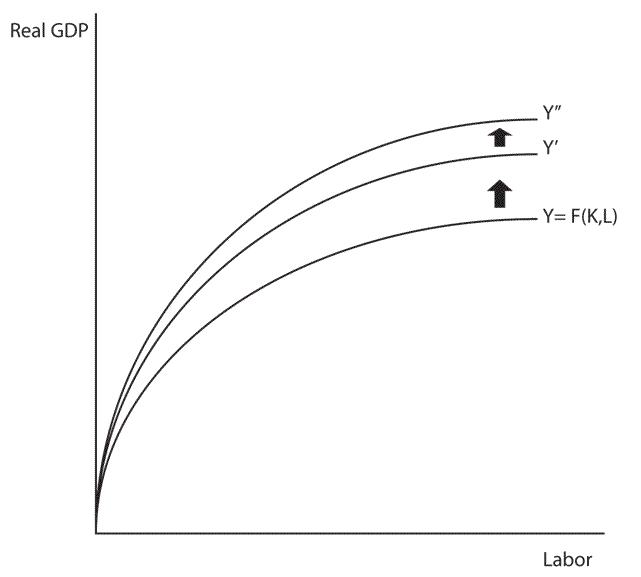
Thus, the Chinese model on increasing the application of technology coupled with increase capital investment enabled it to create an environment for sustained economic growth.
Given the positive environment to promote growth, it is not surprise to see the Chinese economy to regain the title as the biggest economy in the world by 2025 or earlier, as it has been for the past few thousand years. By then global monetary policies will have to synchronize with China instead of the U.S as in the last few decades.
China has also taken steps to enhance and facilitate the Yuan to become one of the future reserve currency in the world by increasing its gold reserves. China’s gold import has reached about 956 tons in September 2013 which doubled that of 2012. According to Bloomberg’s Andrew Cosgrove, China’s total Gold holdings after adjusting imports from Hong Kong and jewelry use, is in the vicinity of 2710 metric tons as compares to the U.S official Gold reserves at 8133.5 tons. He also estimate that the Chinese under-reported their gold holdings by at least 2.5 times.
I am not surprise by his claim as the Chinese tends to under-report their achievements. There is a saying that an astute Chinese businessman normally has 3 copies of accounts. One is for the bank with inflated earnings to maximize loans. Another is for the IRD (Inland Revenue) with depressed earnings for tax evasion. The last one is for himself, where it shows the real Profit and Loss. As such I believed the Chinese Authority; too maintain 3 different accounts on their gold holdings. One each for the CCP, the Chinese Press and the Foreign Press.
By having more physical gold in possession, it will soon have the ability to impede any attempt to manipulate gold price in the futures market. When China’s gold reserve becomes sizeable, then it will have the economies of scale to meet any physical demand. After the failure of launching the much anticipated PAGE (Pan Asian Gold Exchange) last year, China has been mulling on the idea of facilitating physical delivery of gold in both the spot and futures market in the Shanghai Gold Exchange. Being able to deliver physical gold through the ‘gold allocation’ system, it will eventually put an end to the manipulation of gold price in the futures market as now practiced in the West.
Speculators will have difficulty in crashing the spot price by avalanching sell orders in the futures market as they do now. Moreover who wants to trade paper gold when you can get the real stuff? When people start demanding physical over paper gold, then it will lead to a gold rush or ‘gold run’. Eventually, the stampede arising from the ‘gold run’ will cause a sudden melt-up in the price of gold.
by Sam Chee Kong
cheekongsam@yahoo.com
© 2014 Copyright Sam Chee Kong - All Rights Reserved
Disclaimer: The above is a matter of opinion provided for general information purposes only and is not intended as investment advice. Information and analysis above are derived from sources and utilising methods believed to be reliable, but we cannot accept responsibility for any losses you may incur as a result of this analysis. Individuals should consult with their personal financial advisors.
© 2005-2022 http://www.MarketOracle.co.uk - The Market Oracle is a FREE Daily Financial Markets Analysis & Forecasting online publication.


