


Warnings of Impending Stock Market Top Suggest Decline into end February
Stock-Markets / Stock Markets 2014 Jan 13, 2014 - 07:56 AM GMTBy: Andre_Gratian

 Current Position of the Market
SPX: Very Long-term trend - The very-long-term cycles are in their down phases, and if they make their lows when expected (after this bull market is over), there will be another steep decline into late 2014. However, the Fed policy of keeping interest rates low has severely curtailed the full downward pressure potential of the 40-yr and 120-yr cycles.
Intermediate trend - As a result of minor cycles due to bottom in late February, a short-term top appears to be in the making.
Analysis of the short-term trend is done on a daily basis with the help of hourly charts. It is an important adjunct to the analysis of daily and weekly charts which discusses the course of longer market trends.
"IF SANTA FAILS TO CALL..."
Market Overview
The Trader's Almanac is famous for pointing out seasonal patterns in the stock market. One of the most predictable one is the "Santa Claus rally". The STA states: "Santa Claus tends to come to Wall Street nearly every year, bringing a short, sweet respectable rally within the last five days of the year and the first two in January." It also points out that: "Santa's failure to show tends to precede bear markets".
So how did Santa do this time? Not so good! That time frame consisted of the top segment of a rally which had started on 12/18, and the result was a net gain for the 5-day period of a puny 3 points! So does that mean that we can expect the bull market to end this year? Probably a good bet! I have been touting the Kress cycles which are due at the end of 2014 for some time. These are long-term cycles that should make their lows around October. They include the 120-year cycle, and one of its most distinct components, the 40-year cycle. As I have mentioned repeatedly in past newsletters, I had expected them to make their presence known much sooner. In May through September, it looked as if they were finally in the process of putting an end to the bull market which started in March 2009, but it was only a false alarm!
An important thing to keep in mind about cyclical patterns is that, although they repeat themselves with regularity, they seldom do so in the same way. Keeping a flexible mind-set about cycles -- and everything else which concerns the stock market -- is essential to successful investing. And wishing or expecting the market to behave in a certain way is one of the first things that should be on our "not-to-do list". And yet, because of our human nature, it is one of the most difficult things to learn. Objectivity is not our strongest suit!
So, starting the New Year with a completely open mind (Hmm!), what do we see? The warning which is included in the first paragraph should be heeded, but let's wait until we see some definite signs that the bull market end is upon us. True, there are many other warnings that one can point to but, collectively, they are still not waving a red enough flag. Let's see what we can glean from our analysis!
Chart Analysis
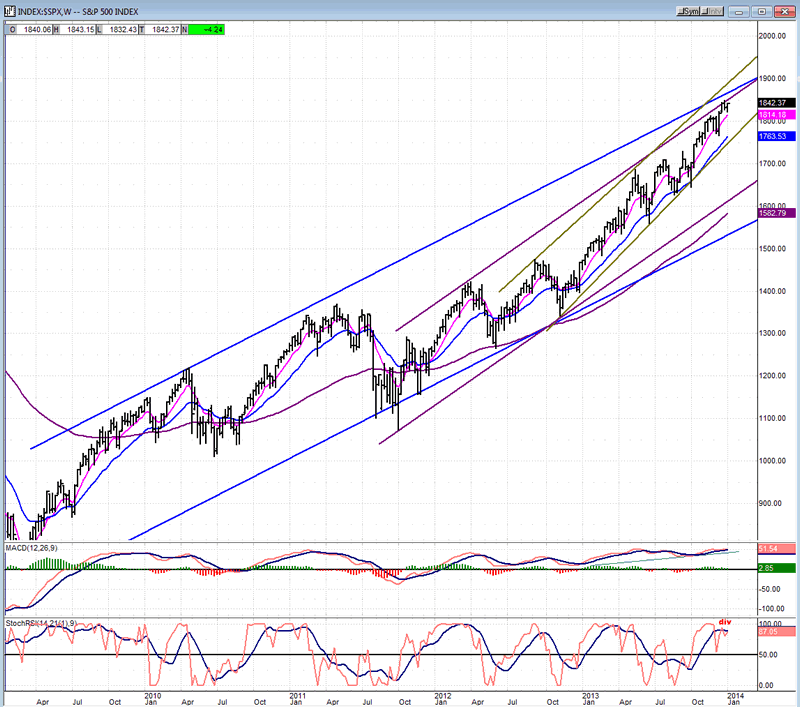
The SPX weekly chart (courtesy of QCharts) is a good place to start. In order to keep things consistent with previous articles, I have drawn the bull market channel (blue) by connecting closes instead of intraday prices. This is one way to keep the entire price span within the main channel. We can see that the index has progressed to the top of the blue and purple channels where, ostensibly, it should be meeting with resistance. But even if it is, there is no long-term sign of deceleration in this chart. In the past 15 months, prices have traveled the full width of the channel without a significant consolidation. There is perhaps a suggestion of a wedge starting to form at the top of that run, but nothing that hints at a serious and immediate decline. The beginning of intermediate deceleration, however, is reflected in the indicators; especially in the SRSI which has started to roll over for the first time since its August low. Should the pattern progress in the way that the previous ones have, a decline of several weeks could follow. That would not immediately jeopardize the long-term trend, but it could be the start of a more obvious topping formation.
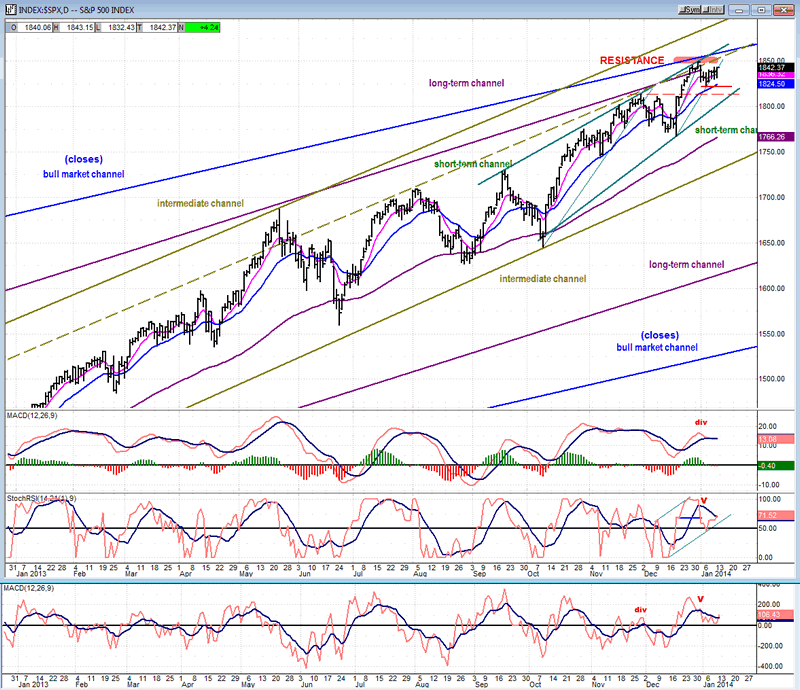
The daily chart does show that resistance is being met in that area. Since the beginning of the year, the SPX has not been able to recover from a 3-day, 25-point drop. No serious damage has been done and the short-term trend line is still intact. Even if the decline should make more progress, it appears that there is some good support not far away.
The oscillators, which had given a tentative sell signal, have taken advantage of the sideways move to stabilize above the zero line. Since the middle of the week, the lower two even started to reverse, suggesting that the line of least resistance may be turning up. However, as we will see on the next chart, the hourly oscillators are quite overbought, and the pattern being made on the daily chart is more likely to be only a halfway correction.
From a structural standpoint, it looks like an a-b-c correction is underway with the c wave still to come and likely to find support between 1810 and 1813. Minor cycles are mixed in this time frame with some bottoming and some topping and we'll have to see which ones achieve near-term dominance.
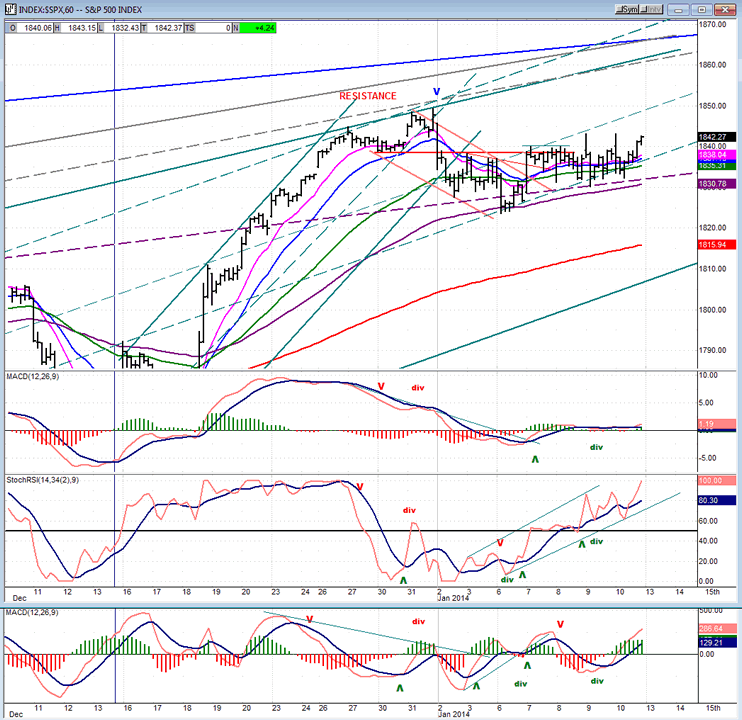
The hourly chart clearly shows how overbought the SRSI is. In spite of the sideways move in price, the it has risen all the way to the top of its range and is vulnerable to a retracement. There could still be room for a little more upside, and SPX could rise up to the dashed line above which has provided some resistance before and may do so again. As I pointed out in the last letter, there are still higher projections in the vicinity of 1855-1863 which can be reached before the index has a more important correction. It's a question of whether or not it has enough time to reach them before the cycles, which are due to make their lows toward the end of February, capture the short-term trend.
I also spoke of support in the 1810-1813 area, but if we start to decline before making a new high, the distribution phase which has taken place over the past week may carry enough of a punch to take us lower. We'll re-visit this aspect of the correction when we actually start down.
Cycles
Several short-term cycles are competing for the short-term trend in this time frame, and this is probably why the market is moving sideways. Whether or not it can have a final spike before rolling over into the end of February when the lows of more important cycles are due (still the best scenario) will soon be known.
Breadth
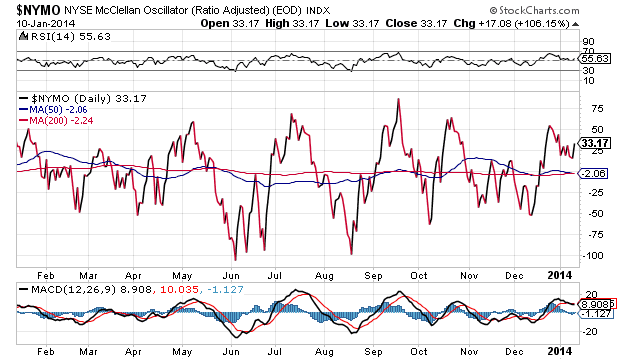
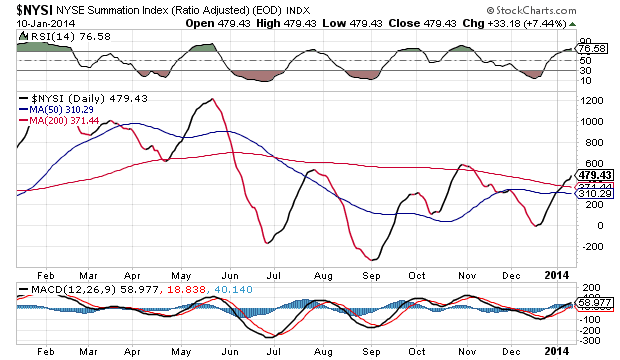
The McClellan Oscillator and Summation Index (courtesy of StockCharts.com) appear below.
There has been little pressure from breadth during the consolidation. The McClellan oscillator has remained well above the zero line and this has allowed the Summation Index to continue rising, but it is not very energetic, and its tepid uptrend has now brought the RSI into overbought territory and made it vulnerable to rolling over once again.
Sentiment Indicators
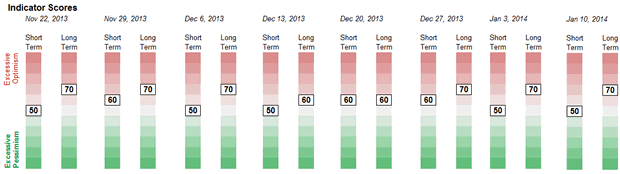
Long-term readings from the SentimenTrader (courtesy of same) remain at 70 for the third consecutive week. Along with other warning signs, this elevated reading could be good enough to facilitate the kind of correction into the end of February that the cycles seem to be predicting. Higher levels will undoubtedly appear before we get to the top of the bull market.
VIX (Velocity Index)
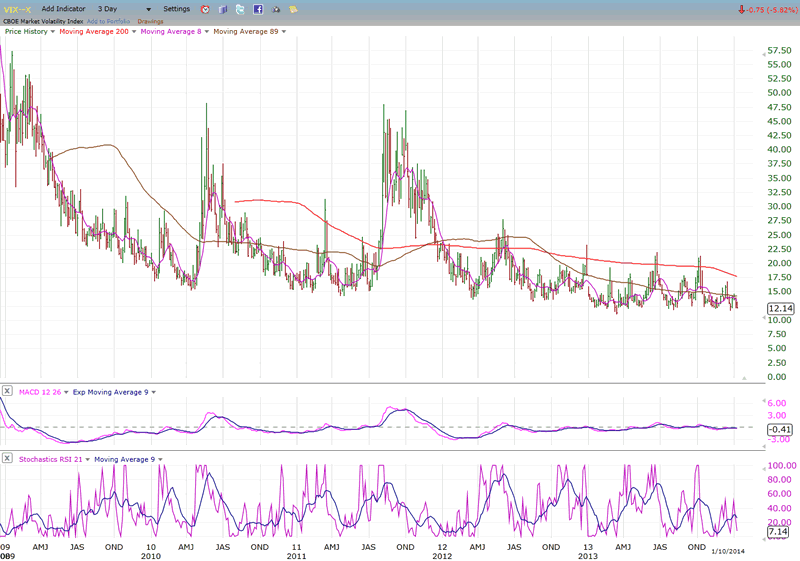
The Volatility Index is in the process of forming a long-term base, and this has kept it in a narrow range from which it still shows no sign of emerging. Only when it begins (in earnest) a move similar to those which took place in 2010 and 2011 can we assume that we may be approaching an important top in the market. Until then, the best we can hope for is an intermediate top.
It is still too early to tell if this is what is in store for the decline into late February. There has certainly been enough distribution established above 1824 in the SPX to bring one about, providing that it is not nullified by another burst of strength to significant new highs. In this case, VIX could rise into the 30s.
XBD (American Securities Broker/Dealer)
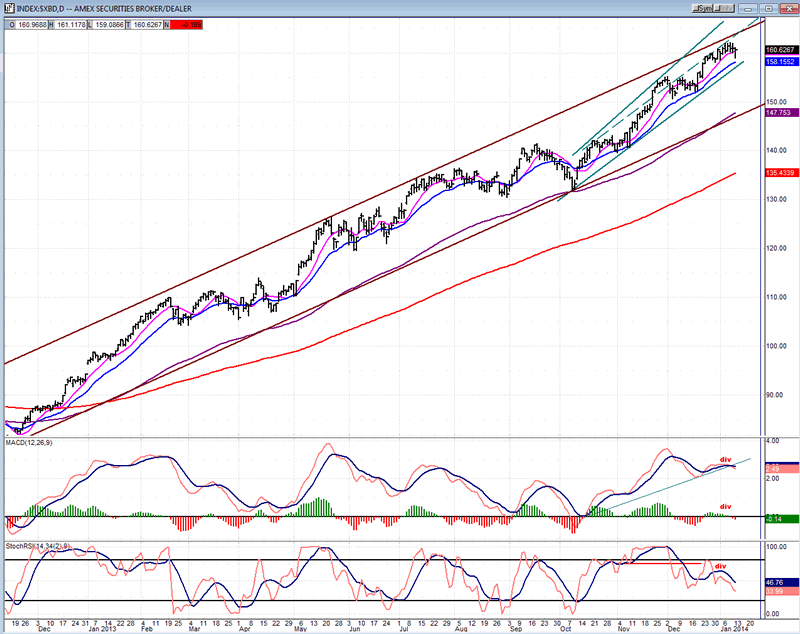
In this space, I have plotted an index which is known for leading the market. Previously, XLF and IWM have been shown. This time, it's XBD (chart courtesy of Qcharts)! They all display similar patterns to SPX with no indication of relative weakness appearing - which is what we would expect to see as we approach the end of the bull market.
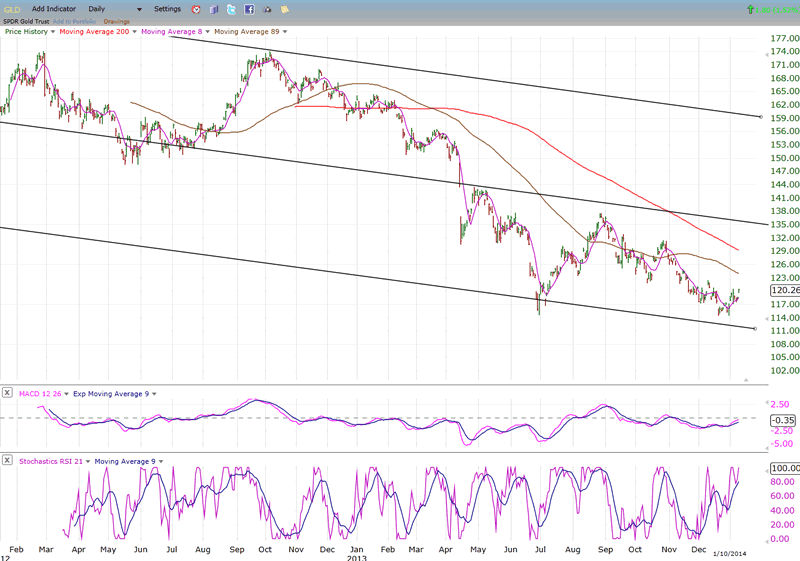
GLD (ETF for gold)
GLD has created a second bottom: 25 weeks since the previous one -- the length of its intermediate cycle. Since that level has held up and a rising trend started, we can assume that the cycle has made its low and has begun to exert upward pressure on prices. It could easily result in a rally of several weeks which could take the index to the area of its September top. It could be the start of an even more important move. Surpassing 138 during the early stages of its 25-wk cycle could result in a challenge of the top channel line.
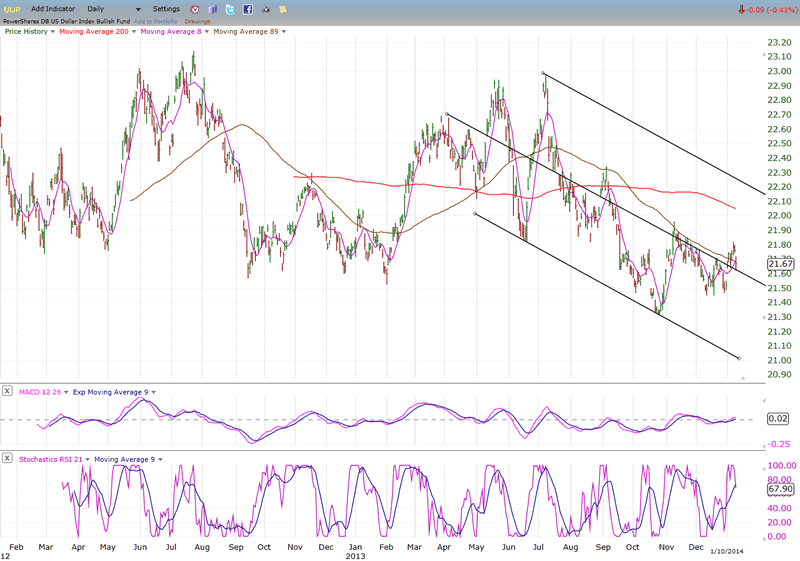
UUP (dollar ETF)
UUP is not following through immediately in its attempt at resuming the short-term uptrend. That probably indicates that some additional basing in this area will be required. A steady dose of tapering by the Fed should eventually boost its price enough to challenge the top of the down-channel.
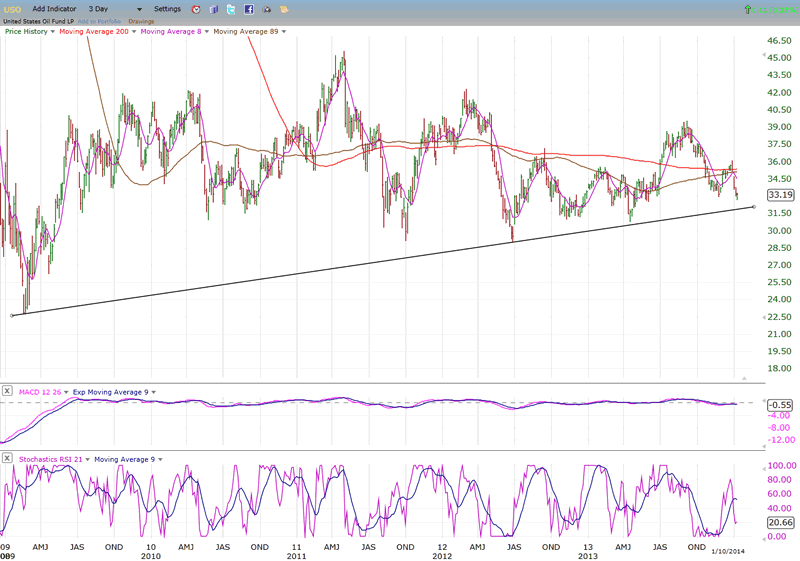
USO (United States Oil Fund)
I have maintained for some time that the path of least resistance for oil prices was down. So far, I see no reason to change my mind. USO is less than two points from its long-term (5 years), shallow, up-trend line. While it could offer some support temporarily, USO has yet to give us any reason to expect that it will not be broken on its way to a re-test of the 2009 low - at a minimum.
Summary
Warnings of an impending top are emerging, but not severe enough to suggest that it will turn out to be the end of the bull market. At best, based on the near-term cyclic configuration, we should expect a decline of a few weeks into the end of February. This should be followed by a resumption of the long-term trend to new highs. Perhaps by then the warnings will have intensified enough to alert us to the imminence of a final top, once again fulfilling the prophecy of a failed year-end rally.
FREE TRIAL SUBSCRIPTON
If precision in market timing for all time framesis something that you find important, you should
Consider taking a trial subscription to my service. It is free, and you will have four weeks to evaluate its worth. It embodies many years of research with the eventual goal of understanding as perfectly as possible how the market functions. I believe that I have achieved this goal.
For a FREE 4-week trial, Send an email to: ajg@cybertrails.com
For further subscription options, payment plans, and for important general information, I encourage
you to visit my website at www.marketurningpoints.com. It contains summaries of my background, my
investment and trading strategies, and my unique method of intra-day communication with
subscribers. I have also started an archive of former newsletters so that you can not only evaluate past performance, but also be aware of the increasing accuracy of forecasts.
Disclaimer - The above comments about the financial markets are based purely on what I consider to be sound technical analysis principles uncompromised by fundamental considerations. They represent my own opinion and are not meant to be construed as trading or investment advice, but are offered as an analytical point of view which might be of interest to those who follow stock market cycles and technical analysis.
Andre Gratian Archive |
© 2005-2022 http://www.MarketOracle.co.uk - The Market Oracle is a FREE Daily Financial Markets Analysis & Forecasting online publication.