


Options Market Forecasting Future Gold Price Action Direction
Commodities / Gold and Silver 2014 Jan 16, 2014 - 01:36 PM GMTBy: Submissions

 Boris Mikanikrezai writes: I discuss how the gold options market is pricing calls and put to gauge traders’ sentiment and figure out whether gold option traders are biased for downside or upside price action.
Let's use risk reversals to assess the future evolution of precious metals. The risk reversal in options market can be defined as the implied volatility on call options minus the implied volatility on put options, both with the same delta and maturity.
We set the maturity at 1 month and the delta at 25. Consequently, in order to compute the 25 Risk Reversal (R25), we will use Call options whose the maturity is 1 month and the strike has been chosen such as the delta is +0.25 and Put options whose the maturity is 1 month and the strike has been chosen such as the delta is -0.25.
In sum, R25 = Implied Vol of the 25 delta call - Implied Vol of the 25 delta put
If R25>0, it means that implied volatility of call options is greater than implied volatility of put options. Call options are more expensive than put options due to higher implied volatility of call options. In other words, upside protection is more expansive than downside protection. Gold option traders are optimistic on gold prices as they are biased for upside price action.
If R25<0, it means that implied volatility of call options is smaller than implied volatility of put options. Put options are more expensive than call options due to higher implied volatility of put options. In other words, downside protection is more expensive than upside protection. Gold option traders are pessimistic on gold prices as they are biased for downside price action.
Exhibit 1: Gold prices and Risk Reversal
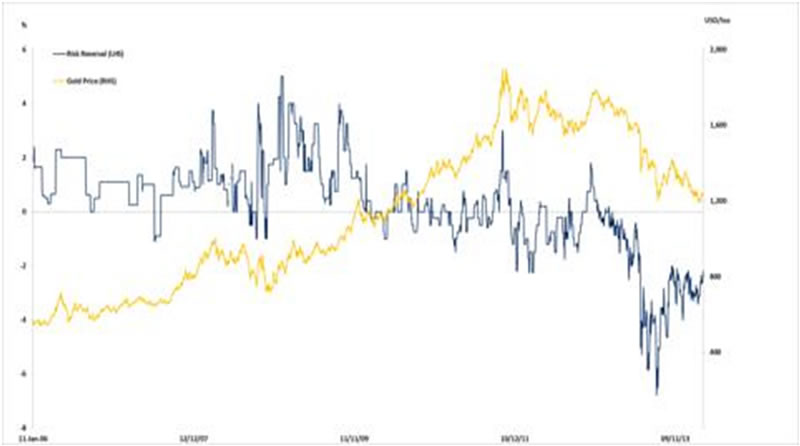
Source: Bloomberg
The chart suggests that a significant change in Risk Reversal indicates a change in market expectations. Indeed, Risk Reversal peaked in August 2012 at 2% to plunge below 0% in February 2013, signalling that the sentiment among market participants had become bearish for the year ahead. Indeed, gold prices started the year on weakness and kept losing momentum at a rapid pace. In fact, the gold market, down by 28%, has its worst year since 1981 when it plunged by 33%.
Let's now examine the recent evolution of risk reversal.
From a short term perspective
Gold prices declined sharply following the conclusion of the December FOMC Meeting (December 18), from $1,244 per ounce to $1,187 per ounce on December 19. It is important to note that gold prices were very close to their June lows of $1,180 per ounce even though they rebounded afterwards. It is also important to note that R25 did not decline too much to the plunge in gold prices, suggesting that market participants did not express a renewed interest for downside protections. This is consistent with the fact that we have seen short covering since December 19. Gold prices increased from $1,187 per ounce to $1,245 per ounce on January 6, 2014.
From a medium term perspective
R25 has rebounded from a low reached in July 2013 at -5%. Today, R25 is at -2%. However, we are still below 0%, suggesting that the gold market is not ready yet to recover as market participants are still worried about further decline in prices. This is also consistent with the recent evolution of gold prices, especially the mini flash crash that occurred on January 6 when gold for February delivery fell sharply by $30 (a 3% decline) from $1,245.50 to $1,212.60 on the COMEX division of the New York Mercantile Exchange in just a minute between 10:14 a.m.33 and 10:15 a.m. EST. I believe market participants should pay a closer attention to that event as this suggests a bearish development in 2014. In fact, these volatile moves affect negatively confidence in the market traditionally, even though it retraces initially. Indeed, a rational investor tends to be out of the market place after surprising increased volatility and illogical moves.
Conclusion
I am sufficiently convinced that the risk to gold is skewed to the downside. I suspect that the retest of June lows at $1,180 per ounce is just a matter of time even though it was proven as solid support because it has already been tested several times in the past.
© 2013 Copyright Boris Mikanikrezai - All Rights Reserved
Disclaimer: The above is a matter of opinion provided for general information purposes only and is not intended as investment advice. Information and analysis above are derived from sources and utilising methods believed to be reliable, but we cannot accept responsibility for any losses you may incur as a result of this analysis. Individuals should consult with their personal financial advisors.
© 2005-2022 http://www.MarketOracle.co.uk - The Market Oracle is a FREE Daily Financial Markets Analysis & Forecasting online publication.