Brent Crude Oil Price Faces Headwinds in 2014
Commodities / Crude Oil Jan 17, 2014 - 10:53 AM GMTBy: EconMatters
 EIA Petroleum Report
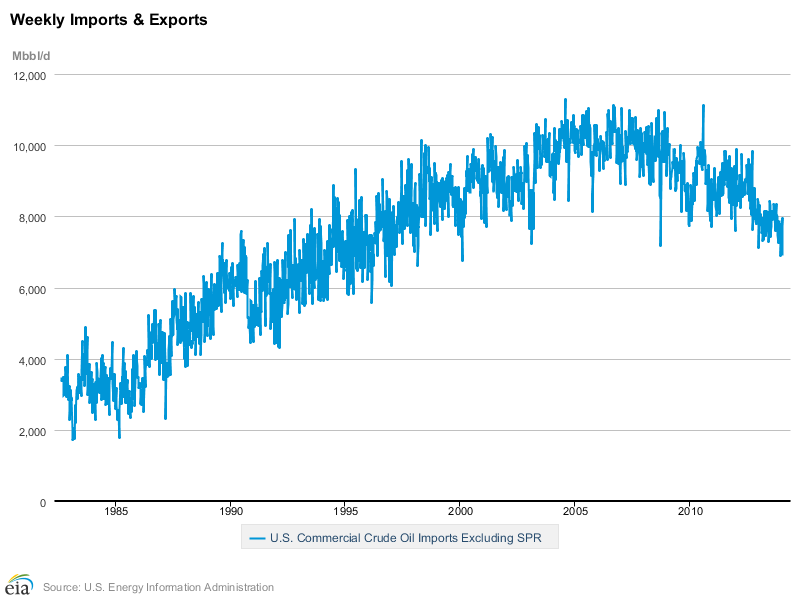
In reviewing the EIA weekly petroleum report, the oil imports figure came in at 6.889 (Million Barrels per Day) for the week ending 01/10/14. This number compared to a year ago 8.030 (Million Barrels per Day) puts a nice cap on the downtrend which really started gaining steam in 2010 onward.
Compare this imports number with the U.S. Production number of 8.159 (Million Barrels per Day) and it is clear that oil is being managed quite effectively to keep supplies and prices in check. A year ago U.S. Production was 7.041 (Million Barrels per Day), and so the goal is to try and offset imports to the increases in U.S. Production by importing less oil.

.png)
Managing Oil Supply
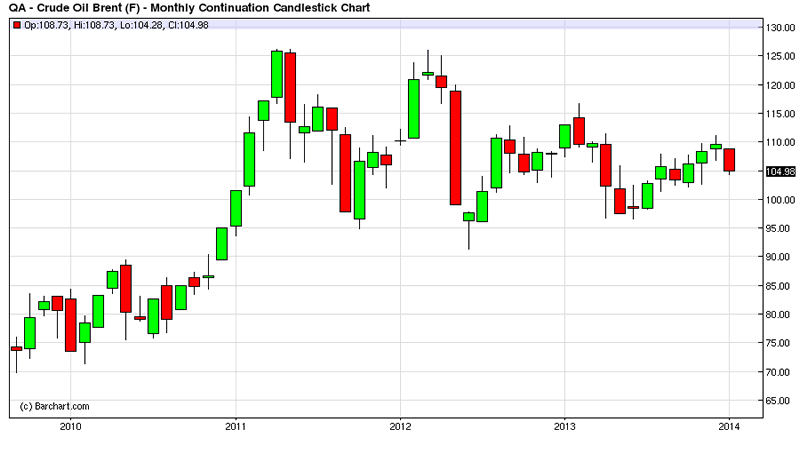
This is inventory and supply management 101, but unlike solar panels where supplies from China flooded the market, and prices plummeted sending many manufacturers out of business, oil and Brent especially has remained relatively high. In fact Brent is actually considerably higher than 2010 when the US was importing much more of the commodity.

Sure one could say that China is utilizing all the spare oil that used to come to the United States, but one look at Australia`s export numbers versus the boom in China for commodities when they were building new cities seemingly every month, seem to tell a different story.
Dramatic Paradigm Shift
These are not small numbers we are talking about here, the differences in U.S. Production and Imports since 2010 to the current numbers is just an incredibly big delta. For example, in 2010 U.S. Production was around 5,500 (Million Barrels per Day) and Imports were around 9,500 (Million Barrels per Day) on average. When one starts running the numbers for the entire year, for three years successively, the dramatic commodity paradigm shift is huge, and the overall number is quite large.
Price Independent of Fundamentals
Moreover, to think that price actually went against this trend in the largest oil consuming market in the world is even more astonishing when you think about it. Sure QE liquidity has in some sense inflated many of these commodities like Gold, Silver, and Copper along with every other asset known to humankind that is traded in financial markets.

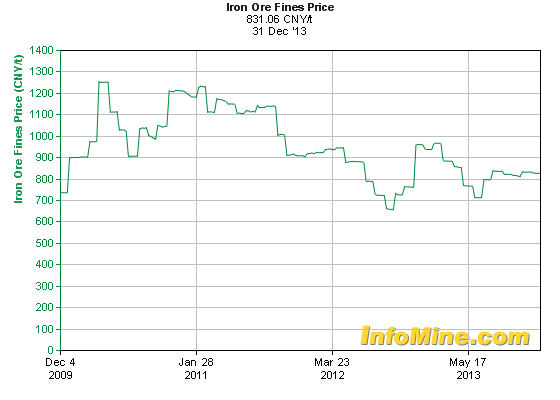
But the major disconnect between the collapse in Iron-Ore prices with the slowdown in China and the rising with Brent Oil prices over the same time period with Global production outpacing demand on a weekly, monthly and annual basis is just an interesting feat in and of itself.
Sure the Middle East has flared up several times, almost every January to April time period for the last three years the Middle East flares up for a short time period. However, no real supply disruptions have materially occurred, and after several weeks of demonstrations, things routinely go back to normal. In the overall big picture these Geo-Political events are mere blips on the radar screen in the oil market.
Middle East Production Changes
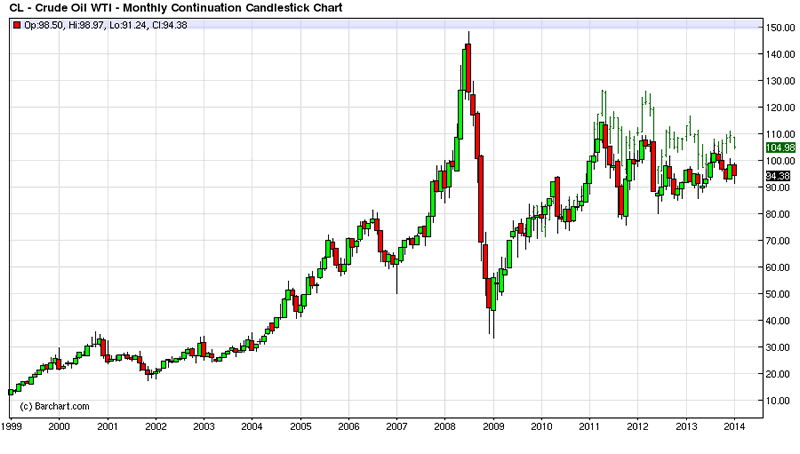
Interestingly now that Iran, Iraq and Libya are all set to pump more oil in 2014 is this finally going to be the nail in the coffin for the Brent contract, so that it trades the bulk of the year on par, or even at a discount to WTI? Not if the US Refining Industry has any say in the matter, this WTI-Brent Spread is crucial for their business model, and they have a vested interest in defending the spread at all costs.

You don`t think this spread exists solely due to natural supply dynamics of the underlying products do you? There are vested interests and stakeholders at play here; the spread is encouraged because it meets the needs of many stakeholders on both sides of the pond so to speak.
Where is Supply Really Going?
It is obvious that a lot of this oil is just staying in the ground; some of it is probably being stored in China on a resource play as they build up their reserves.
But at some point reserves fill up, and these Middle East countries need more and more revenue to meet their expanding budget commitments. Therefore, holding back production to artificially manage global prices by limiting supply works for a while but eventually these same producers are going to need to start producing more to meet the expanding revenue requirements, especially if price is unable to compensate substantially for much lower production volumes.
Consequently, when this happens the world could experience its first real meaningful break in oil prices in the last 10 years (apart from the financial crisis temporary drop) even with a slightly improving global economy.
Final Thoughts
The three contributing factors would be the dynamics of the North American Oil Production market, the ending of QE Stimulus, and the eventual increased production from the Middle East (both in terms of New Oil coming onto the market & the increases in existing supply to meet revenue objectives which is currently being purposefully withheld from the market).
It may take towards 2015 for this to all play out, and with more fuel efficient vehicles in the developed world, and China already struggling with pollution overload ( the last thing they can handle is more cars on the road), it makes intuitive sense that at some point the fundamentals are going to dictate a lower oil price.
Furthermore, one would think that Brent comes under increased pressure in 2014; and accordingly it would seem that any rally in Brent should offer up a nice entry point on establishing a short position in the commodity.
By EconMatters
The theory of quantum mechanics and Einstein’s theory of relativity (E=mc2) have taught us that matter (yin) and energy (yang) are inter-related and interdependent. This interconnectness of all things is the essense of the concept “yin-yang”, and Einstein’s fundamental equation: matter equals energy. The same theories may be applied to equities and commodity markets.
All things within the markets and macro-economy undergo constant change and transformation, and everything is interconnected. That’s why here at Economic Forecasts & Opinions, we focus on identifying the fundamental theories of cause and effect in the markets to help you achieve a great continuum of portfolio yin-yang equilibrium.
That's why, with a team of analysts, we at EconMatters focus on identifying the fundamental theories of cause and effect in the financial markets that matters to your portfolio.
© 2014 Copyright EconMatters - All Rights Reserved Disclaimer: The above is a matter of opinion provided for general information purposes only and is not intended as investment advice. Information and analysis above are derived from sources and utilising methods believed to be reliable, but we cannot accept responsibility for any losses you may incur as a result of this analysis. Individuals should consult with their personal financial advisors.
EconMatters Archive |
© 2005-2022 http://www.MarketOracle.co.uk - The Market Oracle is a FREE Daily Financial Markets Analysis & Forecasting online publication.


