


What Worst Stock Market Start to the Year Since 2005 Means
sitenews / Stock Markets 2014 Jan 20, 2014 - 10:20 AM GMTBy: DailyGainsLetter

Mohammad Zulfiqar writes: Out of the first seven trading days of 2014, the S&P 500 declined on five of those days, marking the worst start to the year for the stock market since 2005. This phenomenon has raised many questions. Looking at this, investors are asking how the returns on the S&P 500 will look this year. Why? Because in 2005, the S&P 500 only increased by 2.87%.
In 2005, the months of July and November were good for the S&P 500; the index increased by more than 3.5% in each of those months. On the other hand, January, March, and April were the worst-performing months that year. In these months, the S&P 500 declined by more than two percent. (Source: StockCharts.com, last accessed January 15, 2014.)
Will the S&P 500 follow the same trajectory in 2014 as it did in 2005?
As it stands, I believe the S&P 500 may perform worse than it did in 2005. As I’ve mentioned in these pages many times before, there are many factors that are leading me to believe this can happen; for example, we are seeing a surge in optimism towards stocks—stock advisors are the most bullish they’ve been since the last market sell-off. As well, the U.S. economic growth isn’t really surprising when you look much deeper into the details, and most importantly; the Federal Reserve has announced that it will start to reduce its asset purchases (quantitative easing). When combined, these phenomena could bring the S&P 500’s performance down this year.
Regardless, you have to keep one of the most important lessons of investing in mind: don’t predict tops and bottoms. The S&P 500 declining on five out of seven trading days doesn’t mean its time to hit the “sell” button. Sometimes, markets can continue to go in the same direction for a while.
To get an idea about where the S&P 500 may be headed—or where the key stock indices may be headed as a whole—I have been watching the chart below.
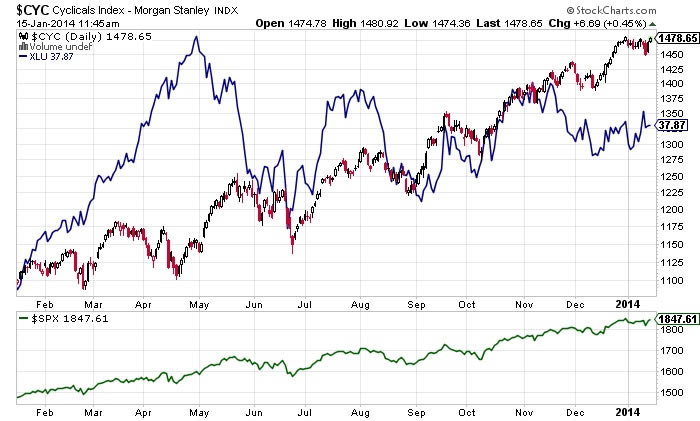
Chart courtesy of www.StockCharts.com
Before going into details, let me explain what this chart shows. The blue line represents the Utilities Select Sector SPDR (NYSEArca/XLU) exchange-traded fund (ETF). This ETF tracks the performance of utilities stocks. The red line represents the Morgan Stanley Cyclical Index. This index tracks the performance of cyclical stocks. Finally, the green line at the bottom of the chart represents the S&P 500.
Currently, cyclical stocks have momentum, while the utilities stocks are stagnant. When this changes—when the utilities stocks start to gain momentum and cyclical stocks start to decline—it may be a sign that the broader market may be turning. Cyclical stocks move with the market and are considered a risky bet. Utilities stocks are safer. Therefore, if there’s more buying in utilities stocks, it suggests investors are disliking risk.
If this situation plays out, then investors should look to take advantage of the momentum in utilities stocks. They may be able to profit from buying into ETFs like the Utilities Select Sector SPDR ETF mentioned above.
This article What the Worst Start to the Year for the Stock Market Since 2005 Means was originally published at Daily Gains Letter
© 2014 Copyright Daily Gains Letter - All Rights Reserved
Disclaimer: The above is a matter of opinion provided for general information purposes only and is not intended as investment advice. Information and analysis above are derived from sources and utilising methods believed to be reliable, but we cannot accept responsibility for any losses you may incur as a result of this analysis. Individuals should consult with their personal financial advisors.
© 2005-2022 http://www.MarketOracle.co.uk - The Market Oracle is a FREE Daily Financial Markets Analysis & Forecasting online publication.