


Stock Market Overbought Consolidation Continues
Stock-Markets / Stock Markets 2014 Jan 22, 2014 - 09:50 AM GMTBy: Andre_Gratian

 Current Position of the Market
SPX: Very Long-term trend - The very-long-term cycles are in their down phases, and if they make their lows when expected (after this bull market is over), there will be another steep decline into late 2014. However, the Fed policy of keeping interest rates low has severely curtailed the full downward pressure potential of the 40-yr and 120-yr cycles.
Intermediate trend - As a result of minor cycles due to bottom in late February, a short-term top appears to be in the making.
Analysis of the short-term trend is done on a daily basis with the help of hourly charts. It is an important adjunct to the analysis of daily and weekly charts which discusses the course of longer market trends.
OVERBOUGHT CONSOLIDATION CONTINUES
Market Overview
Last week, most major indices eked out a new bull market high, with the notable exception of the DOW industrials which remained some eighty points below its former top. This relative weakness should not be of concern unless it continues and increases. However, since we are (still) at an inflection point, every little sign which could point the market's intention should be taken into account. Last Monday's sharp decline was followed by an equally sharp rally, showing that there are still plenty of investors buying the dips. It's now a question of whether the SPX can continue to its assigned projection target of 1855/1863, or if it intends to make a double-top at last week's high.
The action of the past three weeks has created some serious divergences in the daily oscillators. This was made all the more obvious in the SPX when it made a new all-time high last Wednesday, especially since the pull-back into the end of the week caused the oscillators to resume their downtrend. On Monday, the index found support on a 3+-month trend line drawn across the closing prices and, by Friday's close, it had drawn once again within four points of that trend line. Needless to say, the next couple of days will be critical in determining the short-term market direction. The best scenario is still for SPX to reach its target (a few points higher) and then decline into late February in conjunction with the cycles bottoming in that time frame.
Chart Analysis
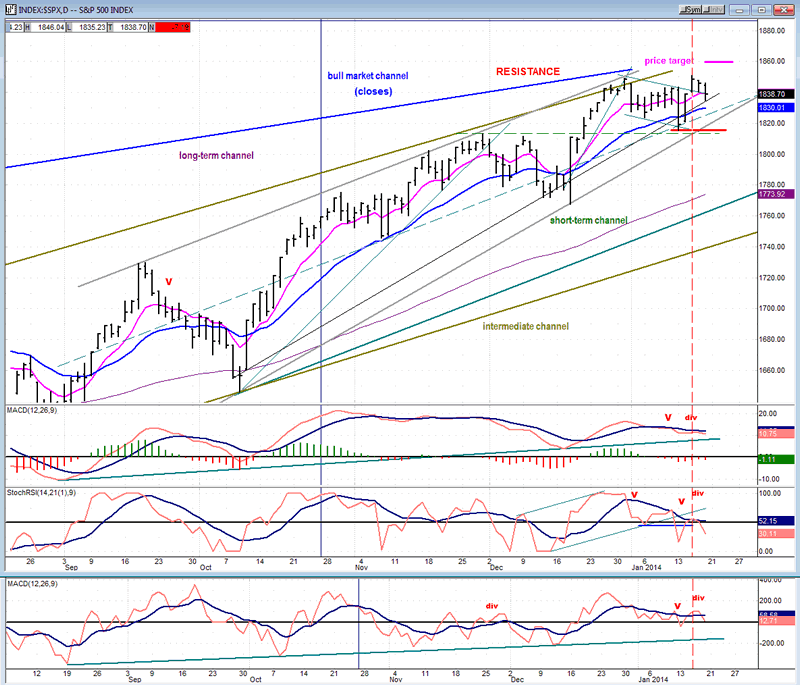
I am focusing my analysis on the last few months of the SPX daily chart (courtesy of QCharts) so that we can see more clearly what has been taking place over the recent past.
The October low created a good uptrend which rose for 167 points before a 45-point correction. This was followed by another 81 point rally to 1849 and a 33-point correction. Last week's rally could only take the index a point and a half beyond the former high before it pulled back again. With this deceleration taking place in the uptrend, it is no wonder that the oscillators are showing some significant negative divergence.
On the chart, I have marked the estimated price target (around 1860). There are also two trend lines drawn across the 10/9 and 12/18 lows. The heavy line connects the intraday prices and the thin line, the closes. You can see how close the inner trend line is to being broken once more. The divergence in the oscillators is marked by the dashed vertical red line. With the oscillators pointing down again, it is possible that the SPX will be satisfied with a double-top around the 1850 level instead of rising to its stated target. Confirmation that the correction into next month has started will come when prices close below 1815 (red line).
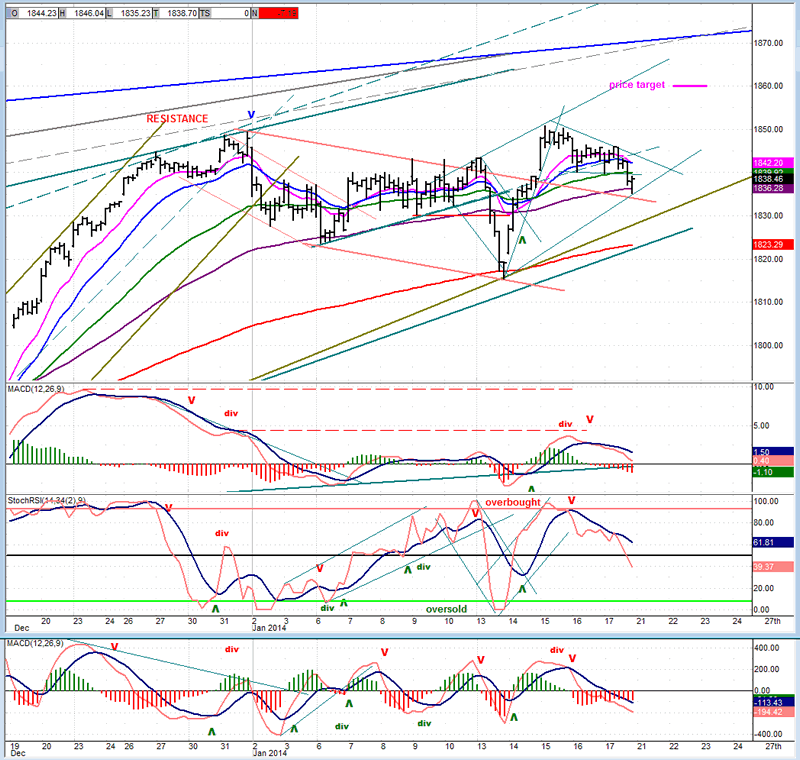
The hourly chart gives the SPX a decent chance of holding at Friday's low. The minor correction took place after the new high retraced .382 of the last rally and found support on the 89-hr moving average, as well as on the extension of the top former correction channel line. The index could take advantage of this combined support to extend its move to the price target before putting in a short-term top.
The hourly oscillators showed no signs of slowing their decline on Friday, and this could be a problem. The SRSI tends to move to the bottom of its range before turning. Here, it has only gone slightly past the middle point -- just enough to turn negative. Of course, this only indicates the market mood at the close of Friday. What really matters is what it will be on Tuesday morning.
The hourly chart shows another reason why the Monday decline stopped where it did: right on the 200-hr MA. This augments the importance of that level if it should be violated as the market continues to decline.
Cycles
Cycle lows are due at the end of February. They could start pressuring the market at any time and bring about a decent correction. Much more pressure is anticipated from the long-term cycles bottoming in the fall but when they will start affecting the market is still an unknown.
Breadth
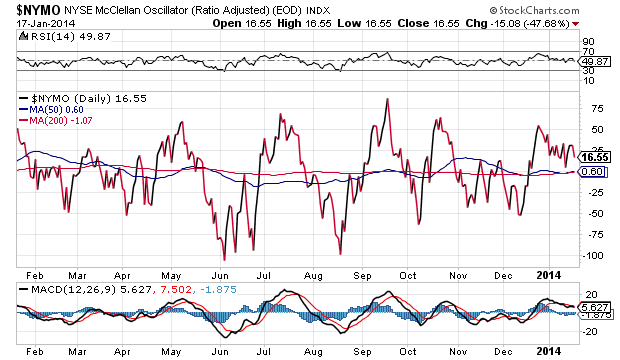
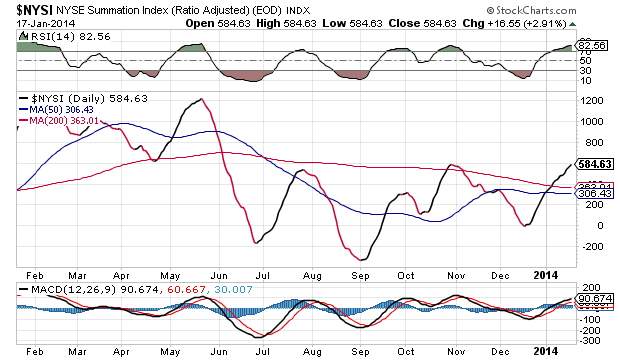
The McClellan Oscillator and Summation Index (courtesy of StockCharts.com) appear below.
The McClellan Oscillator has continued to trade sideways, remaining neutral for the past week in spite of the market volatility. However, the Summation Index has moved higher, and this has caused its RSI to extend its rise into overbought territory, something which does not bode well for the market in the near future.
Sentiment Indicators
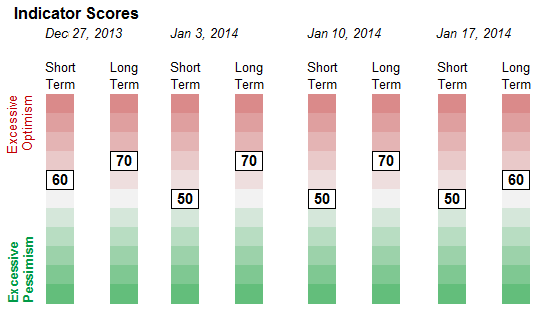
After three weeks of Friday readings at 70, the SentimenTrader (courtesy of same) long-term indicator has moved back down to 60. This is unlikely to have any appreciable effect on the near-term market direction.
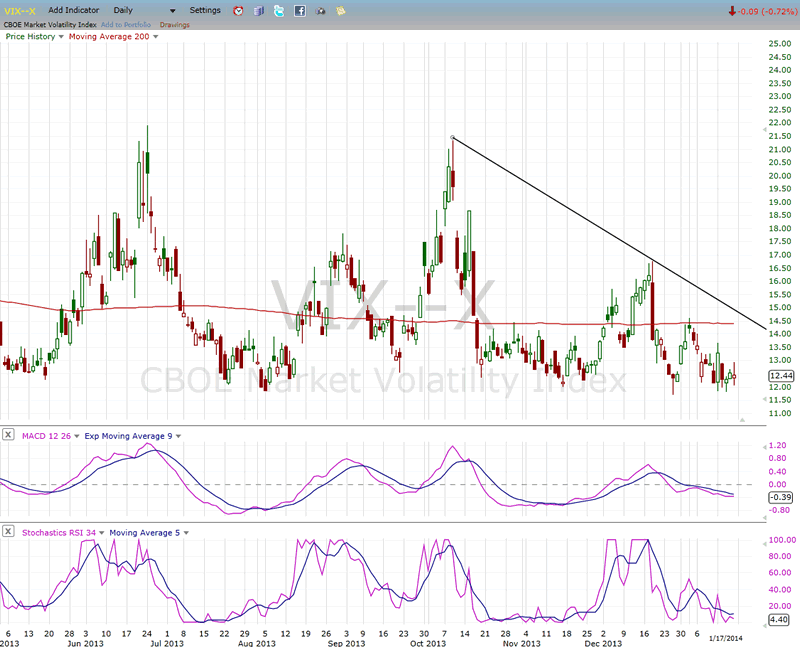
VIX (Velocity Index)
The 'little change' in VIX reflects the recent static performance of the market. I suspect they will both soon wake up at the same time - in opposite directions.
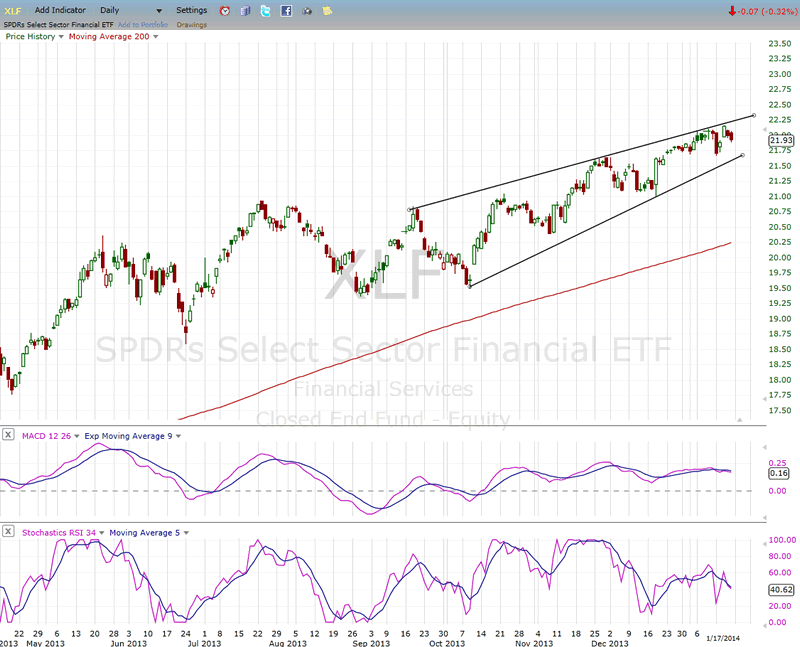
XBD (American Securities Broker/Dealer)
We know that wedge formations are caused by price deceleration. They eventually correct to the downside, as this one surely will. This could take place as early as next week but perhaps not before there is a slight penetration of the upper trend line.
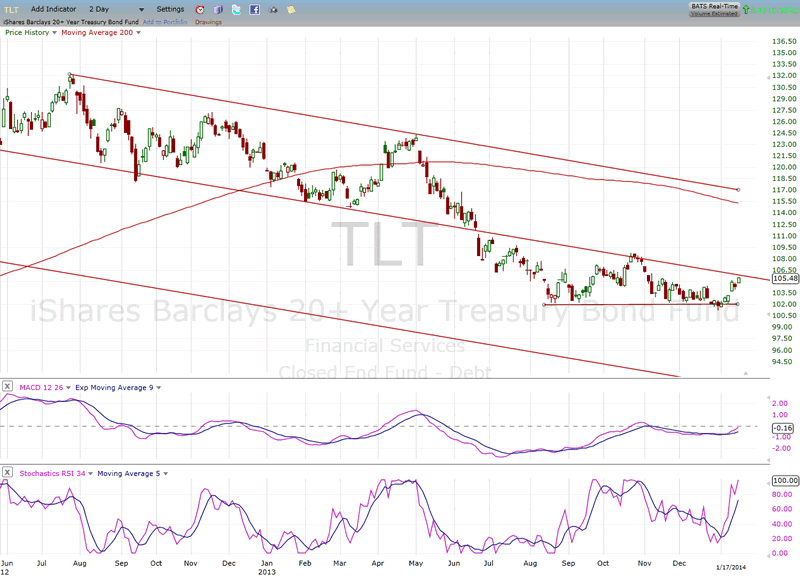
TLT continues to hold above its support level, but the odds of its being in the process of forming a base for an extensive uptrend are rather dim. A more likely diagnosis would be that this is the half-way point of a measured move which would coincide with the degree of distribution established at its extensive top.
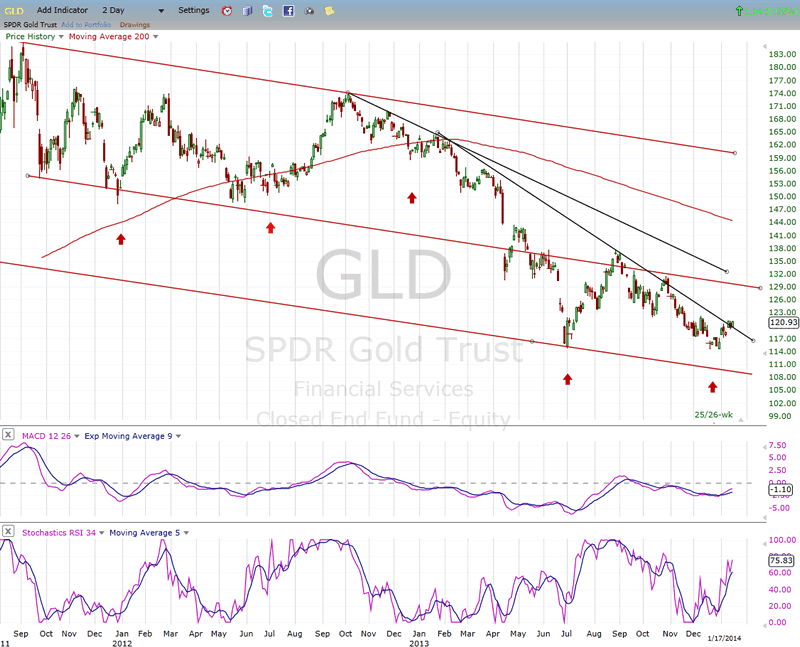
GLD (ETF for gold)
With the assistance of the 25-wk cycle which has now turned up, GLD is trying to establish an uptrend from what could still be a basing formation. When complete, it could take GLD up to the level of the former short-term top - if not higher.
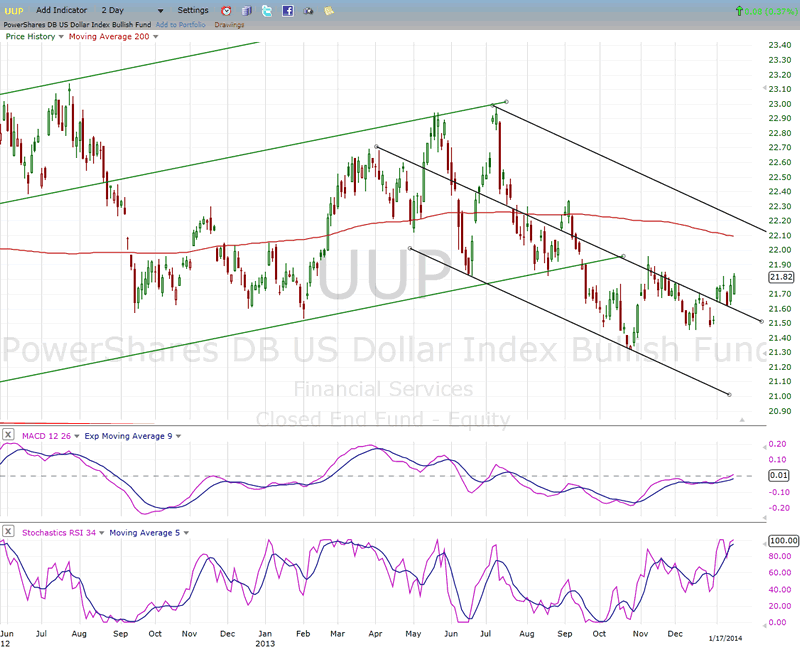
UUP (dollar ETF)
UUP is struggling to reestablish its uptrend. With an SRSI already at the top of its range, it does not look likely to be successful and may have to expand its base at best, and perhaps even temporarily resume its downtrend.
USO (United States Oil Fund)
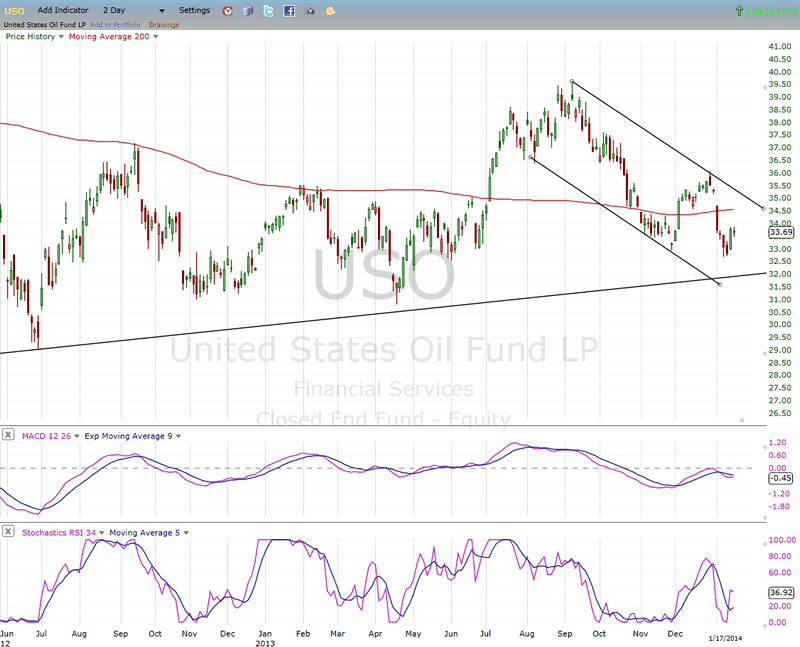
USO is trying to avoid having to challenge its bull market uptrend line which is now only a point away. It's probably only a matter of time before it goes through it.
Summary
The short-term uptrend from 1816 does not look entirely complete and the odds of reaching for the 1855-1863 projection are still fairly good before a decline into the end of February takes hold.
FREE TRIAL SUBSCRIPTON
If precision in market timing for all time framesis something that you find important, you should
Consider taking a trial subscription to my service. It is free, and you will have four weeks to evaluate its worth. It embodies many years of research with the eventual goal of understanding as perfectly as possible how the market functions. I believe that I have achieved this goal.
For a FREE 4-week trial, Send an email to: ajg@cybertrails.com
For further subscription options, payment plans, and for important general information, I encourage
you to visit my website at www.marketurningpoints.com. It contains summaries of my background, my
investment and trading strategies, and my unique method of intra-day communication with
subscribers. I have also started an archive of former newsletters so that you can not only evaluate past performance, but also be aware of the increasing accuracy of forecasts.
Disclaimer - The above comments about the financial markets are based purely on what I consider to be sound technical analysis principles uncompromised by fundamental considerations. They represent my own opinion and are not meant to be construed as trading or investment advice, but are offered as an analytical point of view which might be of interest to those who follow stock market cycles and technical analysis.
Andre Gratian Archive |
© 2005-2022 http://www.MarketOracle.co.uk - The Market Oracle is a FREE Daily Financial Markets Analysis & Forecasting online publication.