


Gold Fails at Resistance Triggering Downtrend
Commodities / Gold & Silver Apr 20, 2008 - 06:51 PM GMTBy: Merv_Burak

 It looked for a while there like gold could break above its previous rally high but a weak momentum and weak volume action put a halt to that idea. Now what?
GOLD LONG TERM
With the action over the past week or so and especially on Friday one might wonder where the long term P&F chart is now. Well, it has changed little since presented last in this commentary on 04 April 2008 . It is in a serious downward trend and has given us down side projections, once a reversal has been confirmed, but the reversal has not yet been confirmed, by my criteria. The price of gold would have to drop to $870 for a reversal to be confirmed. Should that happen then the projections to $840 and $660 come into play.
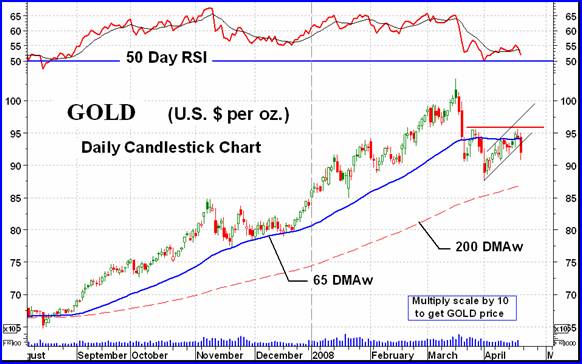
What about the normal charts and indicators? What are they telling us and what is the present long term rating?
There is always some confusion by readers when technicians suggest a rating (bullish, bearish, positive, negative, etc.) for a particular time period. Let's say a rating of bullish is determined for the long term. That DOES NOT imply that we expect the market to CONTINUE to be bullish for A long term. What it says is that based upon the long term charts and indicators of the market, AT THIS TIME, the rating is bullish. If the long term charts and indicators should change in the future then the rating at that time will change.
The closer one expects to be to the top (or bottom) of a trend to identify a reversal the shorter the time period for his charts and indicators. One should never expect to confirm a trend change right at or almost at the very top (or bottom).
At the present time the gold price is still above its long term positively sloping moving average line. The long term momentum indicator is still in its positive zone but moving lower below its negative trigger line. The volume indicator is showing signs of weakness but is still above its long term trigger line. Putting it all together the long term can only continue to be rated as BULLISH . The rating in the Table of technical information and ratings (see end of commentary) has the long term as a + N .
This is due to the use of a different and slightly more aggressive momentum indicator which has already moved into the negative zone. Although I have found that the rating in the Table is very accurate and often (such as possibly at this time) slightly ahead of my review of the RSI as the momentum indicator I am inclined to go with the RSI. An extra week or two to call a long term reversal is not that important. In the mean time the wait could catch a potential whip-saw effect should gold turn around in the next few days. Besides, in the long term I have found the P&F very beneficial and it has not yet called a reversal (but has given a warning by previously moving below two previous lows).
INTERMEDIATE TERM
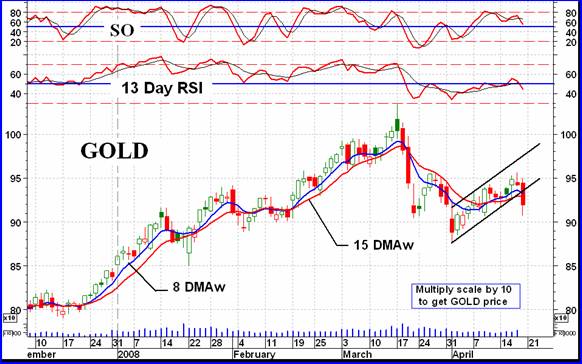
The week started with the intermediate term moving average line turning up and moving oh so very slightly higher, until Friday. It then turned oh so gently lower. Gold itself moved sharply lower and is now below the moving average line. The momentum indicator has been showing weakness throughout this past couple of week rally. Although the price hit the previous high the momentum ended some distance below its previous high. A sharp turn on Friday places the momentum indicator very close to its neutral line although it is still above it in its positive zone. As with the price moving average, the momentum trigger line was moving gently higher during the week but turned downward on Friday. The volume indicator has been below its intermediate term trigger line all week and the line is sloping downward. All in all, the intermediate term rating continues BEARISH.
SHORT TERM
Looking at the short and very short term indicators shows a rally that has been reversed. Friday's action obliterated that short term up trending channel, crossed the moving averages to the down side and turned the averages negative. The short term momentum indicator, which had been moving gently higher and had crossed into its positive zone, has now turned sharply lower and is back in its negative zone. It is below its trigger line with the line now sloping downward. As for the more aggressive Stochastic Oscillator, it entered its overbought line two weeks ago and has been heading lower ever since. It last week's rally the SO did not confirm the price move into new rally highs but stayed below its high from two weeks back. Although not yet in its negative zone it is just a fraction above and another day of downside activity will push it below. All in all, the short term can only be rated as BEARISH and the immediate direction is downward.
SILVER
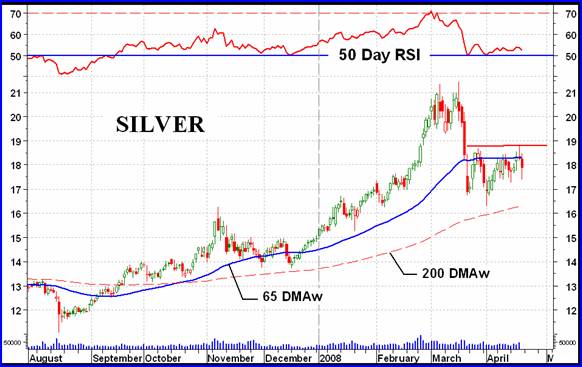
Overall, silver seems to be out performing gold (weekly gain of 0.6% versus gold loss of 1.0%) the chart looks very mush the same as gold. Friday's drop may not have been as severe as was that of gold, when compared to the prior day's of advance, it was never the less a turning point. The inability to breach its previous high and with a momentum indicator that is suggesting weakness behind its rally silver looks to be in a precarious position. It would take only a minor downside move to put the momentum indicator into the negative for the first time since starting its move back in August of 2007. If that should occur with a decisive move by silver below the $17 mark we could be in for a significant downside move. One needs to watch the daily action carefully for the next few days. Watch that $17.00 mark.
PRECIOUS METAL STOCKS
Well, it depends upon what Indices one is looking at to determine what the precious metal stocks did last week. The major North American Gold Indices were ahead by about 2.5% but as I have often cautioned, their Indices place a greater weight on the largest stocks so only a few large stocks provide the major value in the Index. Looking at the various Merv's Indices, which are based upon the AVERAGE weekly performance of all Index component stocks, we get a somewhat different picture.
The Merv's Gold & Silver 160 Index (which includes all of the 100 largest stocks traded in the North American market and highlighted last week) closed lower by 1.1%. By looking at the three sector Indices we see that the 30 largest stocks which make up the Merv's Qual-Gold Index closed higher by 1.1% while the 30 gambling variety which make up the Merv's Gamb-Gold Index closed lower by 2.0%. The action during the week was in the “quality” sector on the up side but in the gambling or more speculative sector on the down side. This is not an indication of a market that is very bullish.
Speculators and investors run to the quality when they are afraid. They run to the speculative and gambling stocks when they have great confidence. This is not a stock market where one should be stocking up on stocks. This is a market where one is out of it or has properly placed stops and one is then just sitting back and relaxing, waiting for things to settle down and confirm a reversal back to the up side before jumping back in. There are always gamblers throwing darts at a list of stocks or the active day trader but these individuals SHOULD understand the risks they are taking and not cry if they should lose.
Merv's Precious Metals Indices Table
Well, that's another week.
By Merv Burak, CMT
Hudson Aero/Systems Inc.
Technical Information Group
for Merv's Precious Metals Central
Web: www.themarkettraders.com
e-mail: merv@themarkettraders.com
Before you invest, Always check your market tirming with a Qualified Professional Market Technician
For DAILY Uranium stock commentary and WEEKLY Uranium market update check out my new Technically Uranium with Merv blog at www.techuranium.blogspot.com .
During the day Merv practices his engineering profession as a Consulting Aerospace Engineer. Once the sun goes down and night descends upon the earth Merv dons his other hat as a Chartered Market Technician ( CMT ) and tries to decipher what's going on in the securities markets. As an underground surveyor in the gold mines of Canada 's Northwest Territories in his youth, Merv has a soft spot for the gold industry and has developed several Gold Indices reflecting different aspects of the industry. As a basically lazy individual Merv's driving focus is to KEEP IT SIMPLE .
To find out more about Merv's various Gold Indices and component stocks, please visit www.themarkettraders.com and click on Merv's Precious Metals Central . There you will find samples of the Indices and their component stocks plus other publications of interest to gold investors. While at the themarkettraders.com web site please take the time to check out the Energy Central site and the various Merv's Energy Tables for the most comprehensive survey of energy stocks on the internet. Before you invest, Always check your market timing with a Qualified Professional Market Technician
Merv Burak Archive |
© 2005-2022 http://www.MarketOracle.co.uk - The Market Oracle is a FREE Daily Financial Markets Analysis & Forecasting online publication.