U.S. Stock Market Sharp Drop - How to Spot the NEXT Big Turn
Stock-Markets / Stock Markets 2014 Jan 25, 2014 - 03:41 AM GMTBy: EWI
 On January 24, the DJIA, S&P and NASDAQ all lost close to two percent. On a day like that, it's worth talking about the one indicator they don't often mention on financial networks - namely, market sentiment.
When is the best time to get out of the stock market? When everyone else is invested and extremely optimistic. When is the best time to buy, then? Exactly: when you see the opposite sentiment.
That's a contrarian view of the market -- and it can be a financial lifesaver.
 What's more, as Robert Prechter, the president of Elliott Wave International, puts it, "the greater the degree of the advance that is ending, the greater the optimism at its peak."
Below is an excerpt from Prechter's recent Elliott Wave Theorist, a monthly newsletter he has published since 1978. It shows you one way how Bob finds bearish and bullish extremes in the market.
Learn how you can see 15 more charts from the Theorist that tell a very clear story for 2014.
Conviction among the Bulls
(Robert Prechter, The Elliott Wave Theorist, December 2013)
The Daily Sentiment Index (trade-futures.com) reported 93% bulls twice, on November 15 and 22. Two readings this high are a rarity.
The weekly Investors Intelligence poll on December 11 and 18 showed over 80% bulls among committed advisors (i.e. bulls/(bulls+bears), omitting those expecting a correction), the highest reading since 1987.
Such extreme readings in conjunction are even rarer.
The Rydex family-of-funds data afford good sentiment indicators. Recent figures show a record low investment in conservative money-market funds, meaning nearly everyone is invested in stocks and bonds.
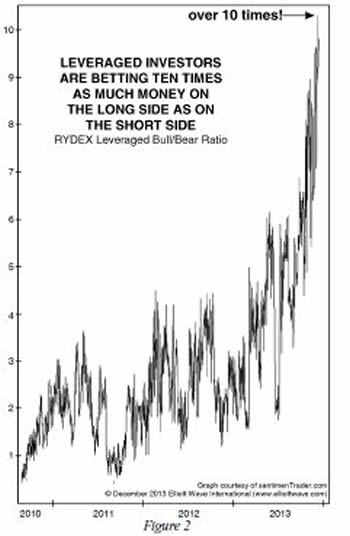
At the same time, the ratio of money in bullish stock funds vs. bearish stock funds is over 5:1, and per sentimenTrader.com the ratio of money in leveraged bull vs. bear funds (see Figure 2) is 10:1!
This reading leaves past extremes in the dust. If you study Figure 2, you will notice that the biggest rush has come in the past six months, which is precisely the time that stocks' ascent has been slowing!
In other words, optimism is soaring while upside momentum is waning.
Once this epic complacency melts, I doubt we will see such a ratio again in our lifetimes.
15 Hand-Picked Charts to Help You See What's Coming in the Markets Have you ever seen price charts that tell a story clearly? Prechter chose 15 charts to explain to his subscribers where the financial markets are headed in 2014. They cover markets like the S&P 500, NASDAQ, the Dow, commodities, gold, and mutual funds. With this information, they are now prepared to be on the right side of the financial markets. You can be, too, because, in a rare opportunity, we can offer you a look at the whole issue -- FREE. Prechter says that "charts tell the truth." Here is your chance to see what truths these charts are telling. If a picture is worth a thousand words, then this latest publication is like reading more than 15,000 words of his market analysis. Get your FREE 10 page issue of Robert Prechter's Theorist now >> |
About the Publisher, Elliott Wave International
Founded in 1979 by Robert R. Prechter Jr., Elliott Wave International (EWI) is the world's largest market forecasting firm. Its staff of full-time analysts provides 24-hour-a-day market analysis to institutional and private investors around the world.
© 2005-2022 http://www.MarketOracle.co.uk - The Market Oracle is a FREE Daily Financial Markets Analysis & Forecasting online publication.


