Stock Market Update: Hitting on All Cylinders
Stock-Markets / US Stock Markets Apr 21, 2008 - 12:34 PM GMTBy: Dominick
 In a period that had many traders guessing about earnings and the economy, TTC canceled out the noise last week and booked steady gains by doing what we always do: trading the charts. As the headlines raised the specter of economic depression and an earnings recession, the tape was hinting all along that the market wanted higher. And just as the majority of traders were fooled, the market screamed up to where it's been saying it was going all along.
Going back to our 1256 number that had us buying the bottom in January, and to our Elliot wave count that had us looking to get long again at the end of March, this update has used a wide array of techniques to read the tape and trade according to what the market says, not the pundits, or talking heads. Technical analysis still has its detractors, and I freely admit that not every single approach works every single time (though the accuracy of our numbers is scary sometimes). Still, we compensate by utilizing a wide array of techniques in a broad range of markets, and this week's action was a perfect example.
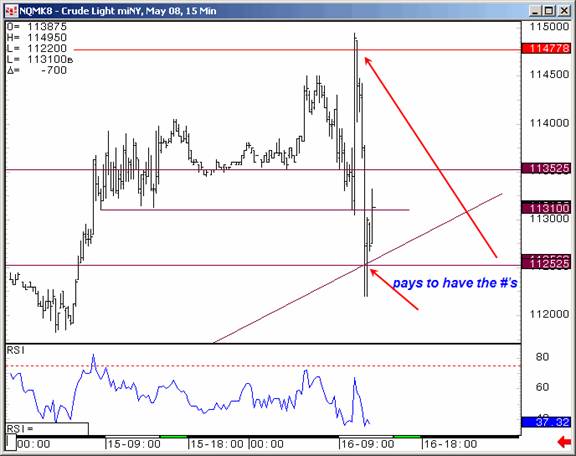
Readers should be familiar with our proprietary numbers, “da numbas”, that work as important targets and pivots to gauge price action. Our trade by numbers approach paid off in oil this week as shown in the chart above. Not only did the numbers give us resistance to sell, but support to cover, and hearty profits to boot.
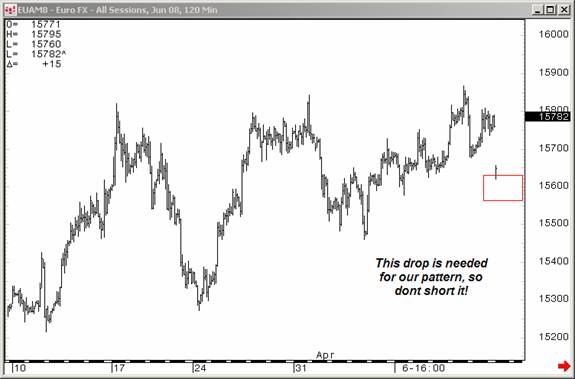
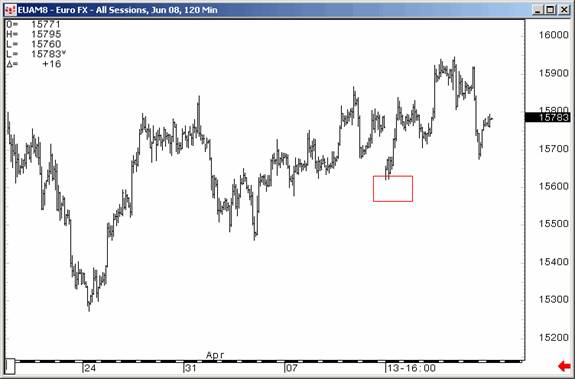
TTC also made profits in the currencies this week using some good ol' Elliott wave theory. Sunday's news of the G7's concerns about the weak dollar prompted the gap down right into a low we needed, as shown above. Members were told not to short the hole, and that more highs were needed before the euro could finally be shorted. As you can see in the chart below, the week unfolded in the way we expected. The Euro is at a VERY important juncture, so stay tuned……
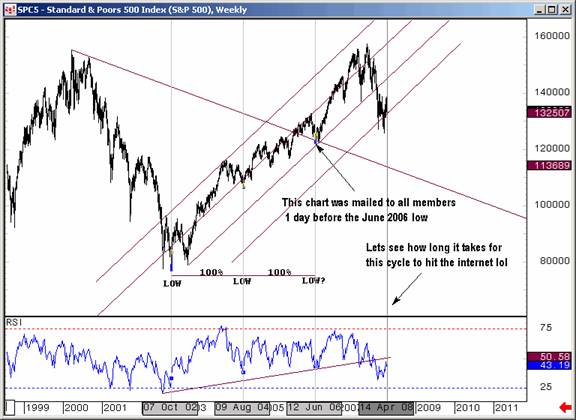
Last weekend's update said, “members are already aware of our all-important line in the sand for next week, have access to the big picture charts in the weekly maps section, and will trade accordingly.” Among those big picture charts was the one pictured below, showing a cycle we've followed for almost a year. We don't necessarily advocate trading based on cycles alone, but, again, our inclusive approach paid off as we went into Monday expecting a cycle bottom, making it that much easier to buy the lows.
We also had a few important numbers in the area to confirm, as shown in the chart below. Time and price were coming together just as everyone was ready to see the trap door open……again.
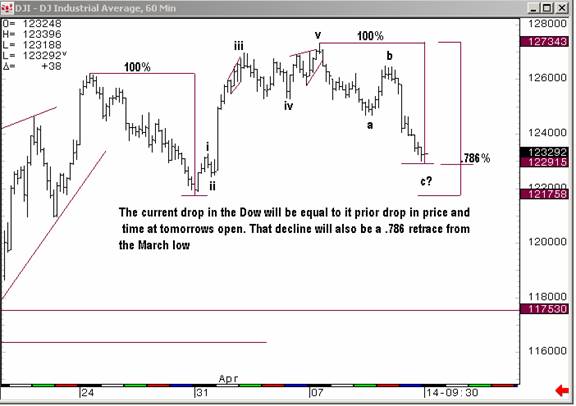
Now that the S&P has moved to test the 1400 level and is essentially toying with the level of the January breakdown, it's natural to expect a period of exploration. But calling for new highs or new lows at this point is simply guessing. Remember this update said back on March 23, as the market rallied off the double bottom,
“If you think last week saw short covering, you really haven't seen anything yet. There's a number not far from here that, if it is taken out to the upside, will trigger a rally I guarantee you will not want to be shorting.”
The rally this week was the natural result of getting above our key numbers and, similarly, the next major move will be broadcast to us as the market responds to other important levels. 1408 is a lower target level to contain any rally and readers should know how important 1360 and 1333 are for opening up more downside. The specific patterns, however, have to be reserved for members.
Do you want to learn how to trade multiple markets in short term time frames with a toolkit of various techniques? Would you like to join a growing community of professional traders and gain access to next week's charts right now? If you feel the resources at TTC could help make you a better trader, don't forget that TTC will be closing its doors to new retail members on May 31,2008 . Institutional traders have become a major part of our membership and we're looking forward to making them our focus.
Are you ready to breakout from bias and trade these volatile markets come what may? Ten to twenty big picture charts are posted every weekend to orient your trading to what the market says, not some bias. But, the opportunity to join the TTC community of traders is slipping away from retail investors. We originally thought we would close the doors to new retail in June or July, but I've decided to move that up closer to May 31, Memorial Day weekend.
TTC is not like other forums, and if you're a retail trader/investor looking to improve your trading, you've never seen anything like our proprietary targets, indicators, real-time chat, and open educational discussions.
But the only way to get in is to join before the lockout starts. If you're really serious about trading learn more about what TTC has to offer and how to join now .
By Dominick , a.k.a. Spwaver
www.tradingthecharts.com
This update is provided as general information and is not an investment recommendation. TTC accepts no liability whatsoever for any losses resulting from action taken based on the contents of its charts, commentaries, or price data. Securities and commodities markets involve inherent risk and not all positions are suitable for each individual. Check with your licensed financial advisor or broker prior to taking any action.
Dominick Archive |
© 2005-2022 http://www.MarketOracle.co.uk - The Market Oracle is a FREE Daily Financial Markets Analysis & Forecasting online publication.


