Yield Curve Inversion and Inflation - Consumer Price Index (CPI)
Economics / Analysis & Strategy Mar 02, 2007 - 02:02 PM GMTBy: Adam_Oliensis
While many argue that the Consumer Price Index is a flawed indicator (some claim it understates inflation and others claim it overstates inflation), it does generate heated debate and can act as a catalyst for stock-market activity. In the context of Fed Chairman Bernanke's relatively dovish comments before both houses of Congress last week, a surprise on the CPI data could easily spur market volatility this coming week.
Currently the consensus estimate is for a +0.1% M/M on the CPI, which is below trend, and would be bullish for stocks. The most recent Y/Y reading stands at +2.61%...
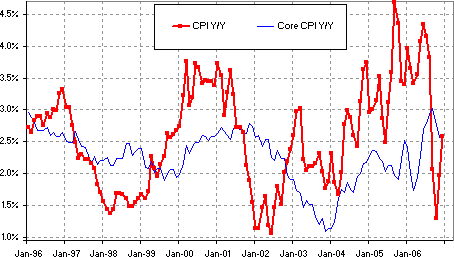
...as does the latest Core CPI number.
For those who are skeptical of the veracity of the CPI series and would rather rely on some of the newer research on the subject, such as the Cleveland Fed's Median CPI and the Trimmed Mean CPI, Here's a chart going back to 1990 that plots CPI, Core CPI, and the two newer versions against one another.
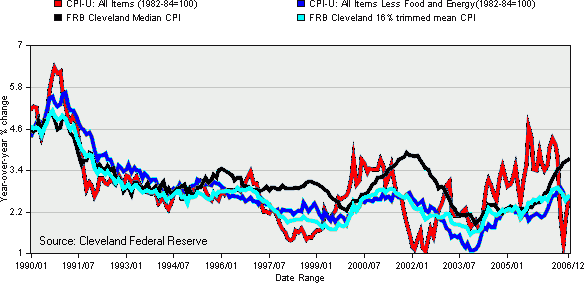
What can we say about each of these series? Well, the CPI (red) is awfully spiky and erratic. But this we know. That's why the Fed looks at the Core CPI (royal blue).
The Core CPI and the Trimmed Mean CPI (light blue) appear to track one another quite closely.
And the Median CPI (black) seems to be off on its own trip at times, bulging higher and floating above the others now and again when it does not look like a good forecaster of the future trend.
As a measure of the relative lack of forecasting prowess held by the Median CPI, let's do a little thought experiment. The last time the black line bulged higher above the other 3, in 2001, do we think that the Fed should have tightened rates?
NOT!
If the Fed has listened to the inflation signals from the black line at that point they would held rates steady or else raised them, and a severe recession (or depression) would have ensued. The black line would have been both a) a poor forecasting tool and b) a terrible policy guide.
The aggregation of the other 3 lines on the chart at or below +2.6% looks to be a much better measure of where the trend in inflation is at present. Moreover the PCE Deflator (most recently at +2.3% Y/Y--not shown), the Core PCE Deflator (+2.2% Y/Y -- also not shown), and theDallas Fed's Trimmed Mean PCE inflation rate (+2.5% Y/Y -- also not shown), further confirm the rate of the trend, with 6-month annualized Trimmed PCE inflation at +2.1% and the 3-month annualized rate at +2.0%.
Still further, the Treasury Inflation Protected Securities (TIPS) market appears to be essentially in agreement with the lion's share of these other inflation metrics.
In terms of inflation expectations over the coming 5 years, the TIPS market is pricing in a Breakeven Inflation Rate (blue line below) of +2.32%, compared to +2.4% at the beginning of the month and +2.64% last August. (If we use the Cleveland Fed's method of adjustments for liquidity and other factors, the figure may be below +2.2%)
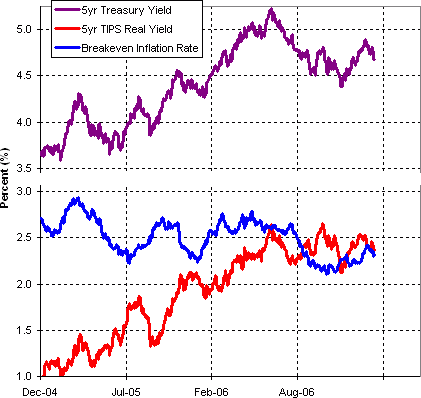
Meanwhile that same TIPS market is generating a Real Yield (something very close to expected Real GDP) of +2.36%, down from +2.63% last October.
So, while inflation expectations, which had been creeping up in the latter half of January, have more recently begun to drop down again, so too have expectations for economic growth, as recent economic data has suggested that the strong GDP data from 4Q06 (+3.4% annualized real growth) will be revised downward, perhaps as much as by -1%.
Lower inflation? Good for stocks. Slower economic growth...not so much.
In line with deteriorating expectations for economic growth has been the consensus estimate for Forward 52- Week Earnings per Share (F52W EPS) on the SPX (blue line below).
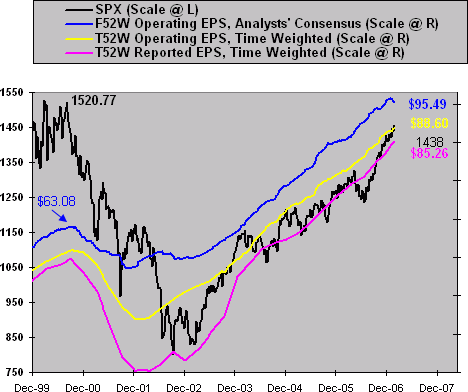
Over the past 4 weeks the blue line has fallen by more than $1 from $96.54 to $95.49, which drops the consensus for Forward Earnings growth relative to Trailing Earnings to a trend-like +7.8%, down from 11.2% last October.
The good news for the economy continues to be that the deceleration in earnings seems to be largely predicated on diminishing profits in the Energy sector.
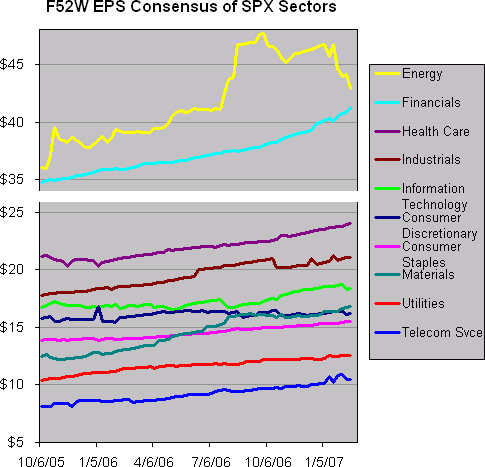
Since the end of September almost $5 has been lopped off the consensus for F52W EPS in the Energy patch while the trend has remained above the waterline for all other 9 sectors in the SPX.
While the consensus for forward earnings growth is decelerating for the SPX in aggregate, (black dotted line below), only Energy (yellow) is below 0%.
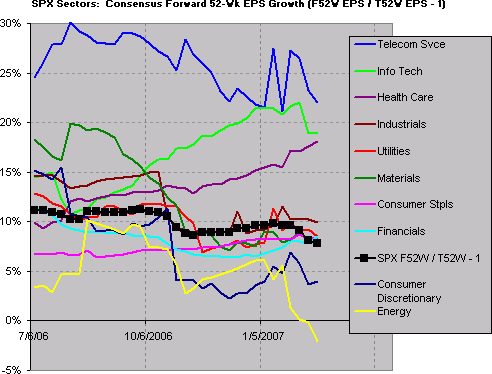
We continue to see some wobbliness in forecasts for earnings growth in Information Technology as well as in Industrials, Utilities, and Consumer Discretionaries, but despite the most recent volatility in expectations the overall growth picture for Telecom Services, Info Tech, and Health Care look especially positive.
If there's a recent development that's cause for concern in my mind it's the steepening of the inversion of the yield curve. That is, bond investors have bid up prices again, dropping the 10-Yr Treasury Yield (TNX) down to 4.69%. Meanwhile the Effective Fed Funds Rate is at 5.29%. So, the yield curve is -0.60%.
Bond investors are willing to settle for paltry yields, which suggests that the prospects for nominal GDP growth have fallen back again.
Remember, my bullish forecast for 2007 is built on long-term bond yields tending to rise throughout the year as investors discount accelerating nominal GDP growth. So, if the yield curve continues to steepen its inversion, then we may have to back away from some of our bullishness and begin discounting a rockier (rather than soft) landing.
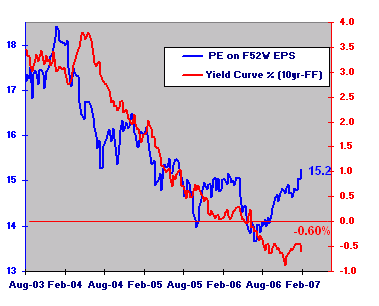
I suspect that in the context of an inverted yield curve (and especially of a steepening inversion) the market's PE is unlikely to continue to expand as it has since last summer. Note that since '03 there has been a strong correlation between the sinking market PE and the flattening (and then inverting) yield curve. At present PE is rising as the trend in the yield curve resists doing likewise. I continue to suspect that that divergence is unsustainable.
Unless the bond market starts discounting accelerating economic growth I suspect that the "cap" on PE will be not too far above where it is now.
Earnings estimates are falling. The market is discounting higher valuation on what is likely to be a decelerating revenue stream. Low inflation helps by lowering the rate at which future earnings are discounted. But low inflation can only help so much. At some point decelerating growth will be interpreted negatively rather than as just a function of diminshing inflation.
The temptation exists to poo-poo the inversion of the Yield Curve as "different this time." But at some point in the not-too-distant future bond and stock investors are probably going to have to come to some sort of closer agreement about what the prospects indeed are for the economy. A condition in which the bond market is discounting +2.36% real GDP and in which the stock market is discounting earnings growth that's a 3.3 times greater...well, that's very likely unsustainable.
The time is right for the market to "take stock" of these factors.
Best regards and good trading!
By Adam Oliensis
Editor The Agile Trader
In 2007 the Agile Trader Index Options Service has closed trades for gross gains of +34%, +8%, +15%, and +31% for a gross total of +88% in position gains with no losing trades. In 2006 the System grossed +682% in position gains. (Of course, gross portfolio performance depends upon asset allocation.) If you would like to read more about The Agile Trader Index Options Service, CLICK HERE. And if you would like a free 1-month trial to the service (offered for a limited time), CLICK HERE and then click SUBSCRIBE .
After the Great Bear Market of 2000-2002 every single trader I knew from “back in the day” was wiped out. I got hurt too. Big time. The game had changed on so many different levels that everything I thought I knew turned out to be essentially useless. So, I started over. From scratch. I began to try to understand what was really driving the markets. I began the search for a trading model (or system) that would work in bull markets, bear markets, and trendless markets as well. I began the search for a system that would help to minimize the stress of trading too. Why? Because, the wild, emotional swings were taking their toll on my personal life, on my marriage, and on my relationships with my kids. And if our results using the Dynamic Trading System are any indication, we have found what we were looking for!
DISCLAIMER - All securities trading, whether in stocks, options, or other investment vehicles, is speculative in nature and involves substantial risk of loss. We encourage our subscribers to invest carefully and to utilize the information available at the websites of the Securities and Exchange Commission at http://www.sec.gov and the National Association of Securities Dealers at http://www.nasd.com . You can review public companies filings at the SEC's EDGAR page. The NASD has published information on how to invest carefully at its website. We also encourage you to get personal advice from your professional investment advisor and to make independent investigations before acting on information that we publish. Most of our information is derived directly from information published by companies or submitted to governmental agencies on which we analyze and/or rate from other sources we believe are reliable, without our independent verification. Therefore, we cannot assure you that the information is accurate or complete. We do not in any way warrant or guarantee the success of any action you take in reliance on our statements, ratings, or recommendations.
© 2005-2022 http://www.MarketOracle.co.uk - The Market Oracle is a FREE Daily Financial Markets Analysis & Forecasting online publication.


