UK House Prices vs Earnings, Immigration, Public Spending, Unemployment and Affordability
News_Letter / UK Housing Feb 22, 2014 - 09:06 PM GMTBy: NewsLetter
 The Market Oracle Newsletter
Janaury 21st , 2014 Issue # 2 Vol. 8
UK House Prices vs Earnings, Immigration, Public Spending, Unemployment and Affordability
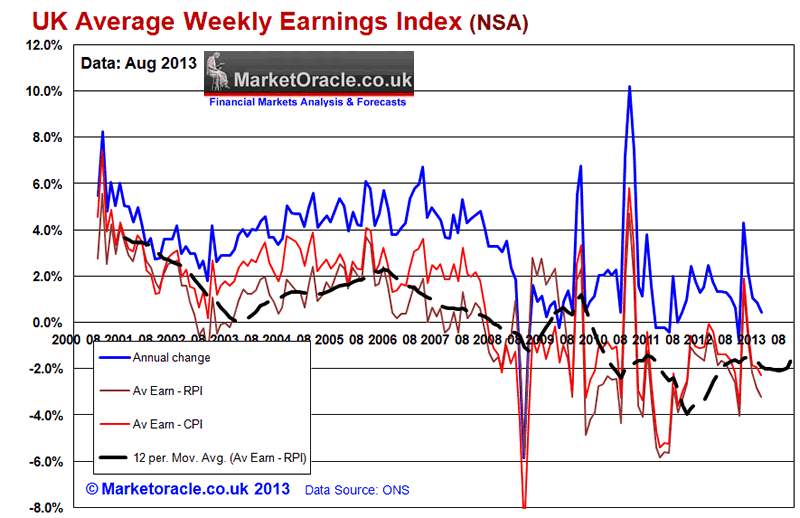
Dear Reader Politicians have been busy in recent months making a series of speeches warning of the cost of living crisis as liberally reported on by the mainstream press, a crisis that manifests itself in earnings unable to keep pace with even the official rate of inflation that has been systematically revised over several decades to under report the real rate of inflation. The persistent lack of apparent housing market affordability has encouraged many academic economists and journalists to warn of falling earnings against rising house prices as a fundamental reason why house price rises are unsustainable as obviously people just do not have enough money to finance house purchase costs such as mortgage payments as prices rise, and thus deflation is always deemed to be just around the corner. We'll as I will illustrate in this article in my UK housing market series that they are once more WRONG! I have periodically warned of the expected fall in earnings as a consequence of the exponential inflation coupled with tax rises and middle class benefits cuts in terms as illustrated by my article of near 2 years ago that warned of a further erosion of wages of 15% to 25% that was expected to especially hit the middle classes hard following the tapering and withdrawal of child benefit for many middle class families despite the fact that it was never really a benefit for middle class workers but in fact a tax rebate i.e. they were getting back some of the money that they paid in taxes to cover bringing up children which is in comparison to the benefits for life baby making factories that not only have never done a days work in their lives but see their children as means to gaining more benefits the most extreme case of which in recent years was the Philpott's case, who risked and ultimately did kill their 6 children as a consequence of incompetence in carrying out their plan who's aim was to gain more benefits. 04 Mar 2011 - Inflation and Tax Rises Crush Britain's Middle Class, Real Earnings 25% Drop! Middle Classes To Lose as Much as 25% of their real earnings. Whilst the poor can rely on benefits and the rich can rely on capital growth to profit from asset markets being inflated by the central banks far beyond the official inflation indices. However that leaves 70% of the British population that class themselves as being middle class to feel the full force of the Inflation and economic austerity mega-trend. Whilst many students (middle class wannabe's) have woken up to a near tripling of the debt burden they will be placed under, however, the situation for Britains vast middle class is set to get far worse than that which even the dire inflation outlook implies because on top of the inflation stealth theft of wealth and wage purchasing power there are a series of tax rises and benefit cuts due to hit the middle class workers of Britain and especially those with children as taxes rise such as national insurance, and tax allowances are cut, and benefits (tax reimbursements) such as tax credits are reduced and in many cases totally withdrawn which means middle class workers could be hit by an additional loss of earnings purchasing power of 5% per annum on top of the real inflation theft of at least 3% per annum, none of which features in any Bank of England or Government economic propaganda report. Whilst trying hard to refrain from using expletives here, but the middle class of Britain is truly FQ&*ED! Middle class families will typically be poorer by between 15% and 25% by April 2013, as from Jan 2013 many benefits will be cut such as the universal tax free child benefit payments being ripped away that alone amount to a loss of 7% of disposable income for a £45k wage earner with 3 children, that is destined to break the backs of many a middle class family fighting hard to stay above water in the wake of soaring prices. The workers of Britain have been losing real disposable earnings purchasing power at an average rate of 4% per annum, the trend is pretty much in line with my analysis as excerpted above which warned that workers should expect to lose between 15% to 25% of the net real terms value of their earnings over the next few years. This has now taken place as a consequence of the three policies of quantitative easing (Inflation), Tax rises (VAT,duty, tax free allowances frozen) and economic austerity (cuts in benefits such as tax credits and child benefit, and cuts in public services that now have to be paid for privately). The following graph shows that even on the most recent data, that despite an improvement over the preceding years, the level of real average earnings are still not keeping pace with the cost of living and it is this which will be a critical factor in terms of the outcome of the next general election, as if the Tory led Coalition government fails by the end of 2014 to have engineered a positive trend in average earnings then it is highly probable that the Conservative party will not take part in formation of the next government. However, given the lag in the data I do expect this indicator to have turned positive during Q2 of 2014 as a consequence of an election inflationary boom.
However given the fundamental drivers of the British economy, I don't expect the positive trend to be sustainable much beyond the next general election, as the UK looks set to enjoy a temporary boom in real earnings during 2014 and into the May 2015 general election that looks set to quickly evaporate during the remainder of 2015 and for much of 2016. The main reasons why real disposable wages will continue to be depressed are as a consequence of exponential inflation, continuing tax rises / benefits cuts (tax rebates), continuing mass immigration that depresses wages and the unproductive public sector spending black hole that expands each and every year as follows : A. Bailing out the bankster elite whom the politicians ultimately serve the interests of. The estimated cost in terms of money printing across a myriad of schemes such as QE of £375 billion, Capital injections, loans to banks such as Northern Rock and Bradford and Bingley that will never be repaid, funding for lending, paying out bonuses to staff of tax payer owned banks such as Lloyds and RBS on the basis of fictitious profits, compensation payments such as PPI, that in total I estimate to be at least £800 billion of tax payer support. Virtually ALL of which is OFF balance sheet hidden behind a myriad of Bank of England smoke and mirrors and so does not officially contribute towards Britains official debt dynamics but obviously does have economic consequences in terms of inflating the money supply which feeds the fires of exponential inflation and its consequences in terms of asset prices such as housing and stocks that tend to be LEVERAGED to inflation. B. Out of Control Immigration This is primarily a Labour conspiracy of the past 13 years as the Labour government sought to maintain a permanent hold on power through the importation of over 2.5 million adults (with at least an additional 1 million children) 90% of whom would be expected to vote Labour. The reason why this was a conspiracy is that whilst mass immigration was taking place Labour politicians could be seen bending over backwards to reassure the people of Britain that no such immigration was taking place and that just 13,000 people per annum were entering the country when the reality was one of net immigration of over 250,000 per annum, some 20 times the Labour governments propaganda. Therefore mass immigration of the 2000's was a Labour government conspiracy that attempted to hide from the people of Britain their plan for the wholesale importation of new Labour voters to bolster their election winning chances, the result was that the Conservatives failed to win an election in 2010 even though the economy was in a state of economic collapse that would normally have resulted in a landslide victory. Lately, in great irony the same former Labour government ministers that instigated the immigration crisis can be found warning of its consequences in terms of breakdown of civil order as illustrated by the former Labour Home Secretary David Blunkett's recent warnings of the influx of Roma communities from eastern europe into his home city of Sheffield, where the Roma population has soared from less one hundred 8 years ago to well over 4,000 today, concentrated in pockets of the city such as Page Hall, that he warns could spill over into violence on the streets due to the clash of cultures between the indigenous / settled communities and the huge Roma influx underway as Czech, Slovak and Romanian Roma villages have literally moved lock stock and barrel to places such as Sheffield to draw on benefits that are more than 20 times that they were in receipt of in the likes of Romania, for instance a family of 4 in Romania would be in receipt of benefits of approx £75 per month, whereas in the UK benefits would total more than £1600 per month. Therefore it is no surprise that many hundreds of thousands of Romanian and Bulgarians have already moved to the UK with several hundred thousands yet to come during 2014. BBC - David Blunkett riot fear over Roma migrant tensions Tensions between local people and Roma migrants could escalate into rioting unless action is taken to improve integration, David Blunkett has warned. The former home secretary fears a repeat of race riots that hit northern cities in 2001. His concerns centre on the Page Hall area of Sheffield, where Roma migrants have set up home. "We have got to change the behaviour and the culture of the incoming community, the Roma community, because there's going to be an explosion otherwise. We all know that." "If everything exploded, if things went really wrong, the community would obviously be devastated. We saw this in Bradford, Burnley and Oldham all those years ago when I first became home secretary. We saw that the community itself were the losers." He called on the Roma community in Page Hall to change aspects of their "behaviour", such as congregating on the streets on summer evenings and dumping litter, which he said was "aggravating" local people. ‘The Roma youngsters have come from a background even more different culturally, because they were living in the edge of woods, not going to school, not used to the norms of everyday life. We’ve got to change that.’ "We've got to be tough and robust in saying to people you are not in a downtrodden village or woodland, because many of them don't even live in areas where there are toilets or refuse collection facilities. You are not there any more, you are here - and you've got to adhere to our standards, and to our way of behaving, and if you do then you'll get a welcome and people will support you." - David Blunkett - Sheffield - Brightside MP, Former Labour Home Secretary Future Waves of Endless Mass Migration Whilst a huge influx is under way as consequence of opening Britain's borders to the likes of Bulgaria and Romania, however this represents just the tip of the mass migration ice-berg, for we will soon find that countries such as Bulgaria and Romania will become hubs for officially sanctioned human trafficking as these countries seek to profit from selling EU citizenship to migrants from across the world perhaps for a fee of Euro 40,000 or even eventually as low as Euro 10,000 as countries can legally seek to capitalise on their membership of the E.U., that many other poorer EU countries such as Greece and Czechoslovakia will seek to replicate. This will allow many more hundreds of thousands of migrants each year from outside of the EU to use the poorer EU countries as a route towards gaining EU citizenship that will allow them to settle in Britain. In summary mass immigration has always been a Labour tactic to retain power in cities such as Sheffield, for instance mass immigration enabled Labour to size power back from the Liberal Democrats in Sheffield in 2011 as over 90% of immigrants tend to vote Labour as the traditional party of immigration. The mass immigration of 2.5 million of mostly low paid workers of which over 90% of whom are in receipt of benefits such as housing benefit and tax credits that contrary to the propaganda of working immigrants paying taxes when the reality is that they tend to take many times more out then they pay in taxes when taking all benefits and services into account and this does not even take into the account non working immigrant families towards which councils have a legal obligation to house.
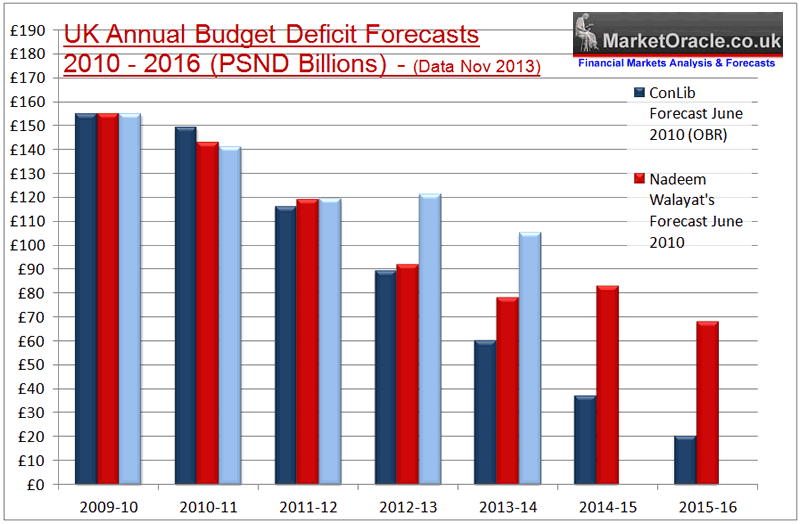
c. PUBLIC SECTOR Vested Interest Workers Governments of all persuasions continue to maintain the vested interest pool of public sector workers who act to reinforce the power of the state in peoples every day lives, where even so called front line workers mostly just tend to go through the motions of providing services to the general public that can best be measured in terms of quality of service when compared against similar private sector services. For instance the well publicised free NHS health check for the over 40's take approx 15 min's and are administered by health care assistants whilst a private health test costing £250 takes 2 hours and tend to be delivered by a doctor. Clearly the private health check is far more in-depth an comprehensive than the free NHS health checks such as actually measuring the functioning of ones heart rather than just guessing from a few multiple choice questions, that and the word free should be exchanged for taxed, as GP practices receive payments from tax payers for each NHS health check. So, if someone thinks they need to have a health check then they would be best advised to get the job done properly with a private comprehensive health check that actually covers what is needed form a health check rather than just going through the motions to earn GP practices extra income. The consequences of funding the gravy train life styles of the unproductive and uncompetitive public sector is that as my recent analysis illustrated (UK House Prices Forecast 2014 to 2018, The Debt Fuelled Election Boom ) manifest itself in persistently high budget deficits that continue to feed Britain's ever expanding debt mountain as illustrated below.
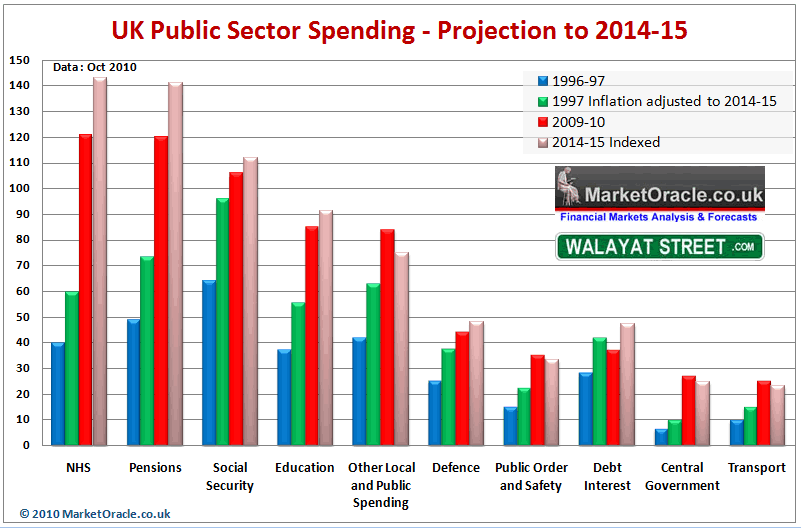
Taking a close look at the break down in public sector spending reveals the truth of what I originally warned of soon after the formation of the Coalition government that it would be impossible for the government to cut the deficit whilst ring fencing of the largest vested interest budget heads such as the NHS and pensions - 22 Oct 2010 - UK Public Sector Spending Cuts Impact on Deficit, Debt, Unemployment and Economy UK Public Sector Spending Projection to 2014-15 The following graph translates the announced cuts into spending department budget totals as phased in over the next 4 years (2014-15) after being indexed for inflation at 3% per year.
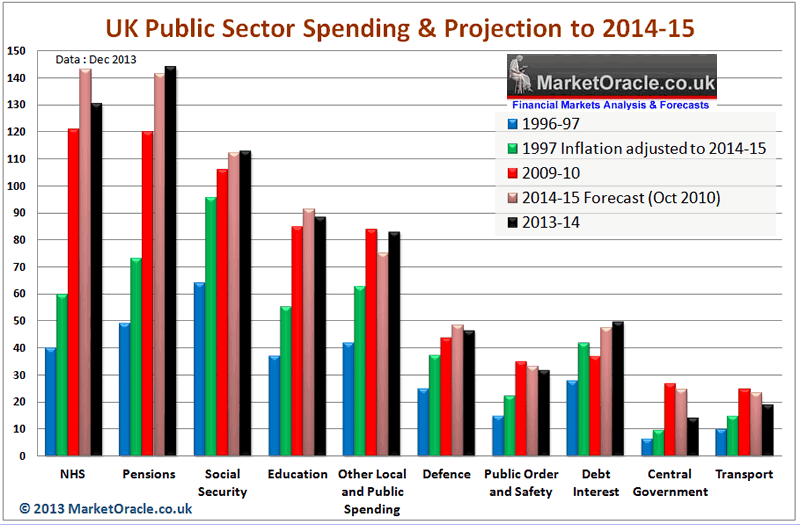
The graph shows that virtually every spending department will increase in nominal terms from 2009-10 to 2014-2015. Even budgets that have declared cuts of as much as 30% will barely see a nominal cut of 10%. The fact is that EVERY year total UK government spending will INCREASE, from £680 billion for 2009-10 of to £739 billion for 2014-15, which is IF the government manages to achieve its spending cut targets as a more probable outcome is for far higher total government spending. Clearly the coalition government has made a huge mistake in ring fencing the NHS, which under Labour had seen out of control spending and when coupled with pensions virtually accounts for the total increase in government spending over the next 4 years. The reason why NHS unions and worker representatives are demonstrating against NONE Existant cuts is because the NHS is so inefficient as an institution that just to stand it still requires annual increases of 7-8%, therefore INCREASING the NHS budget by approx 4% per year has a similar effect as a 3-4% cut, which illustrates why urgent reform if not outright privatisation of the NHS is still necessary to prevent this spending department from bankrupting Britain, as the NHS spending black hole succeeds in undermining all of the other spending cuts put together. For the financial year 2013-14, UK government spending is expected to have risen to £721 billion, that is up by over £40 billion of extra annual spending from the £680 billion total of 2009-10 which is in line with my expectations for annual government spending to continue to grow each year towards a target of £739 billion for 2014-15 which illustrates the bogus debate that politicians and journalists are still engaged in concerning economic austerity government spending cuts that in reality never existed as the media focus has been on just minor isolated cuts whilst ignoring the overall big picture of ever expanding government spending. The updated government budget spending breakdown graph for 2013-14 reveals the truth of the public sector spending black holes because this is how politicians gain control over the people of a nation through the reach of its public sector as they seek to expand this towards an all encompassing state by means of ever expanding mountains of bribes for vested interest workers and voters such as the the 1 million workers and their families that ride the NHS gravy train or the 11.5 million regularly bribed pensioners, or the 6 million reliant on tax credits that ensures that there never ever will be a trend for deflation because the political bribes will ALWAYS expand and as a consequence of which will result in ever higher inflation because that is what happens when governments print money to fill the economic gap generated by unproductive activity i.e. to finance the governments budget deficit.
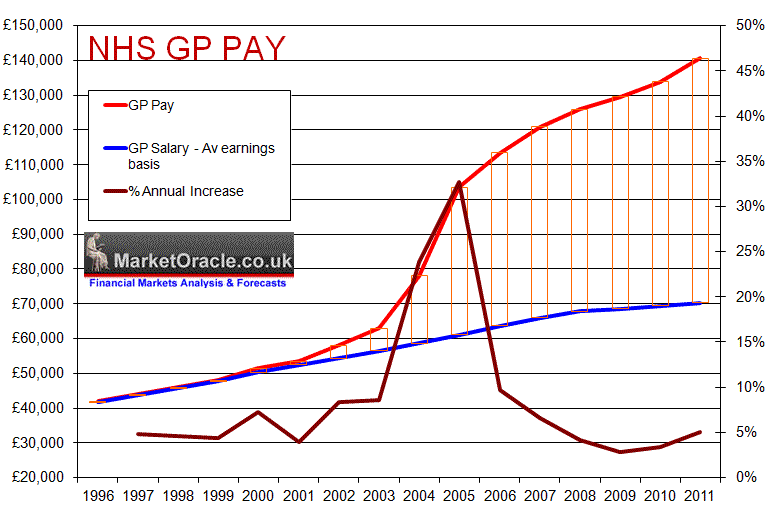
What stands out from the updated breakdown of spending graph are the large out of control spending departments of Pensions, Social security and local government with the NHS and Education not far behind. The soaring social security spending is in stark contrast to the mass hysteria of benefits cuts in the media and amongst vested interest action groups, because as we can see benefits spending continues to increase which in large part is as a consequence of mass immigration of over 2.5 million low paid workers most of whom are in receipt of tax credits and other in work welfare benefits. The only departments that have actually seen a cut in spending are the small spending departments of public order, central government and Transport, which have been far out weighed by the spending increase on just the big Pensions spending department alone. Compared to when Labour took office, the bloated state in real terms is now at least twice as big as it would have been had it just kept pace with inflation and it is under this weight of a continuing huge unproductive public spending that ensures accelerating real inflation consequences against which asset prices such as house prices tend to be leveraged which is why I see this as one of the few asset classes that ordinary people can relatively easily leverage themselves to and profit from over the long-run. NHS Spending Black Hole A closer look at the NHS spending black hole reveals the truth of a health service that countless reports illustrate on a near monthly basis as only tending to go through the motions of providing a healthcare service. All of us have our own real life experiences of an NHS that despite having had its budget more than tripled provides a worse service than it did when Labour first went on its spending binge over 13 years ago. Many GP's seem to have forgotten the fact that the patients sat in front of them have had no choice but to PAY for their services, for had the patient the choice then they would be sat in front of a far more competent GP elsewhere because GP's operate under local monopolies that make it near impossible for patients to choose their GP practice, this lack of competition for patients means that ALL GP practices are in a race to the bottom of increasingly only going through the motions of providing GP services rather than that which are of any real value to patients and hence triggering soaring complaints, let alone the reality of patients not being treated for illnesses that will ultimately become life threatening or at the very least crippling resulting in far greater cost to the NHS. The complaint often put forward by GP's for the lack of competent health service delivery is lack of government funding which does not stack up to scrutiny as the NHS budget under Labour had grown from £40 billion in 1997 to £121 billion for 2009-2010. NHS budgets increasing in line with inflation (CPI) would have seen the budget rise to stand at just £51.6 billion, and probably nearer £60 billion to allow for an ageing population. So the Labour government had in effect spent an extra £60 billion a year, in effect paying for two NHS's despite the public being in receipt of less than one. The Conservative led government has continued pouring money into the NHS black hole albeit at a slower pace which brings the NHS budget to now stand at over £130 billion per year. So where has the money gone ? For the answer we only need look at the pay of doctors, as illustrated by the Labour parties disastrous 2002-2003 GP contracts that sent annual GP pay soaring into the stratosphere, culminating in pay rises of more than 30% per annum, whilst GP's cut back on hours worked.
Similarly, the coalition government reforms for GP consortia to take control of the NHS commissioning budgets are also resulting in a similar disastrous outcome of worse service at far greater cost as a Channel 4 investigation revealed : NHS GP Doctors Putting Profit Before Patient Care, Channel 4 News InvestigationA Channel 4 News investigation charged NHS Doctors with the subversion of the the coalitions governments NHS reforms to result in NHS doctors pocketing all of the cash saved as a consequence of the NHS reforms, which matches my own analysis of 2010 that the Coalition Governments proposed reforms were fatally flawed in that they allowed GP's to profit from patient care. "Your doctor making a profit out of your health care, your GP Sending you to a clinic that he or she owns shares in, we are seeing the biggest shake up of the NHS in its history, Channel 4 news can reveal tonight that there is nothing on the legislation currently before parliament to prevent the outcome no one wants, doctors putting profit before the care of patients, in our special report tonight we show how the new arrangements will create fundamental conflicts of interest potentially harming the trust at the very heart of the doctor patient relationship". Channel 4 News Channel 4 News investigation key points:
Under the previous Labour government patients were treated as credit cards to swipe in and out of door ways as fast as possible to maximise profits. Under the Coalition government patients will now become cash cows to milk to the fullest extent possible, what's best for the health of patients won't even factor into the thought process during GP consultations - "If I send Patient X to Clinic Y for Operation Z, my consortia will earn a commission of £2,000". The NHS GP reforms are pushing towards the worst of both worlds, i.e. no market competition and unprecedented GP control over NHS funds that in significant part will be funneled into the back pockets of NHS GP's via Consortia profits being paid out as dividend to GP partners and eventually huge windfall profits as GP Consortia's are floated onto the stock market. Huge Discrepancy in the Quality of Health Services Most patients have only known the NHS so have never had anything to compare it against as to the quality of the health services they are in receipt of. Therefore the only true way to realise just how bad the NHS is when one conducts NHS and PRIVATE consultations in parallel, which can be an eye opening exercise, revealing the huge discrepancy in the quality of service not only in terms of the time frame for consultations, diagnoses and treatment but in the actual prognosis and recommendations that illustrates what I have often warned of that the NHS in many if not most cases only tends to go through the motions of providing a health service at huge tax payer expense. In fact patients have at best a 50/50 chance that the consultations that they are undergoing are competent as many will be migrant doctors seeing the NHS purely as a means gaining citizenship and ultimately access to work in the private sector. The NHS is just one example of the unproductive public sector for the same takes place right across virtually every public sector department for instance in Sheffield, the inept and incompetent Labour city council cut black bins collections by 50% to cut costs but instead as a consequence of the costs of implementation and additional costs associated in dealing with the resulting fly tipping epidemic have resulted in overall costs actually having gone up! The Primary Purpose of the Public Sector Why do we have an NHS, State education and the rest ? It is because the elite needs docile debt slave healthy workers and that is the primary function of some 5.5 million vested interest public sector workers to reinforce OBEDIANCE amongst their fellow worker slaves, to follow the system that the people of Britain are put on from cradle to grave. Demo racy IS an ILLUSION! I have covered this in depth several times in the past in articles such as -
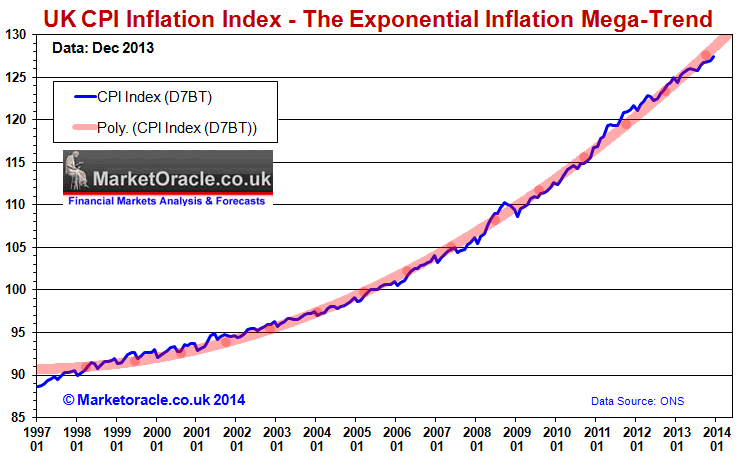
The key to seeking freedom from slavery is to not partake in the system that encourages slavery in the service of the elite which means avoiding state education, avoiding the NHS and going private, avoiding working for a slave master and instead become ones own boss and most importantly of all avoiding DEBT. Do what the elite do, buy ASSETS such as property that is LEVERAGED to the Inflation that the unproductive public sector generates. Falling UK Wages Extra Boost to Economic Recovery For an economy to recover then there has to be an increase in productivity that is able to overcome bankster bailouts and public sector black holes and that is in the real terms fall of not earnings growth but of real disposable income as it is being siphoned off to pay for the former and generate greater productivity for corporations which can then go on to hire more workers, albeit it at pitiful pay rates that don't tend to reduce the burden on the tax payers because of tax credits and other incentive schemes to get the lazy benefits for life into work, but of course as the immigration story illustrates it many hard working eastern european's are driving the increase in corporate productivity but at the cost of taking out of the system far more than they put in as a consequence of the myriad of benefits such as tax credits and services such as the NHS and schools that are consumed far in excess of the pittance of tax that imported workers tend to pay against benefits and services paid out to working low pay families. However again the key is the CYCLE for increasing productivity which has the effect of continuously making corporations more profitable and more eager to expand. Wages Boost During 2014 I expect a stronger economy during 2014 to encourage Britains workers to do what they have not done for the past 5 years which is to ask for a pay rise, which will feed into earnings starting to rise at a faster pace than inflation when compared against the most recent data that shows earnings rising by 0.8% which is set against RPI inflation of 2.5%, so currently a net contraction in earnings of 1.7%, that I expect to be reversed by mid 2014 which would act as a huge boost to the economy, inflation and of course house prices. So whilst as of writing requests for pay rises are in the minority, however by mid 2014 I expect the majority of workers will be requesting and more importantly being awarded significant pay rises. The Implications for House Prices Government spending boils down to stuffing the pockets of public sector workers (in the service of the elites agenda for control) and benefit recipients with money that in most cases they have actually not earned in terms of productive activities, and there persists a continuing pressure for expansion of government spending each year to today's total of £721 billion that perhaps is only backed by £120 billion of actual productive economic activity, resulting in £600 billion discrepancy the consequences of which manifests itself in INFLATION that bubbles up in all areas of the economy for that is what government's printing money to hand out to vested interests in exchange for little or even no productive work results in. This even continues onto the private sector in the form of 6 million tax credits and housing benefit recipients again which acts to dilute economic productivity that deteriorates further with the payments to the 5.5 million benefit claimers for life who could work but choose not to and finally the 11.5 million pensioners who delude themselves that they have somehow put money in during their lifetimes whilst conveniently forgetting that they have already drawn more from the state in the form of services such as health and education than they had ever put in during the whole of their working lives. THAT is where the inflation comes from EACH and EVERY year and that is WHY there will NEVER be Deflation for as I have illustrated above the government instead of cutting public spending has instead INCREASED EVERY year. In my opinion there is ONLY one way for ordinary people to protect themselves from the Public spending fraud and that is to leverage themselves to the Inflation consequences by primarily buying a property to live in which when sold will be tax free. The Exponential Inflation Mega-trend Briefly, without covering what I have already written at length many times, the real inflation truth is far removed from that which the mainstream media tends to focus upon with the annual percentage rates of inflation that masks the truth of what is an exponential inflation mega-trend which is the primary consequences of perpetual money and debt printing monetization programmes that the government is engaged in, in an attempt to buy votes through high deficit spending on a whole host of vested interests, approaching 50% of the population, an inflation trend that asset prices are leveraged to and oscillate around which currently has UK inflation compounding at the rate of 2% per annum that resolves in the following exponential trend.
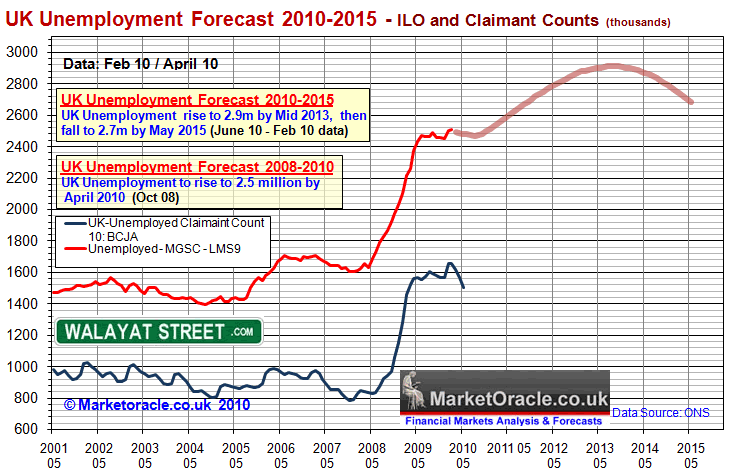
UK House Prices Against Unemployment My long standing forecast as of four years ago was for UK unemployment to trend higher towards a peak of 2.9 million by mid 2013 before trending lower into the May 2015 general election as I expected 70% of the new jobs created under the Coalition government to go to migrant workers as they continue to displace British workers. 01 Jul 2010 - UK Unemployment Forecast 2010 to 2015 Final conclusion - UK unemployment looks set to gradually rise to a peak of just over 2.9 million by mid 2013 before stabilising and starting to decline into a May 2015 General Election of just below 2.7 million against the governments forecast for UK unemployment to fall to 2 million by 2015 (OFBR - Peak at 8.1% this year before falling to 6.1%). The benefit claimant count can also be expected to rise, though is much more difficult to forecast as it is far easier for the government to manage claimant numbers by moving recipients onto other benefits, OFBR forecast a claimant count of 1.17 million by May 2015.
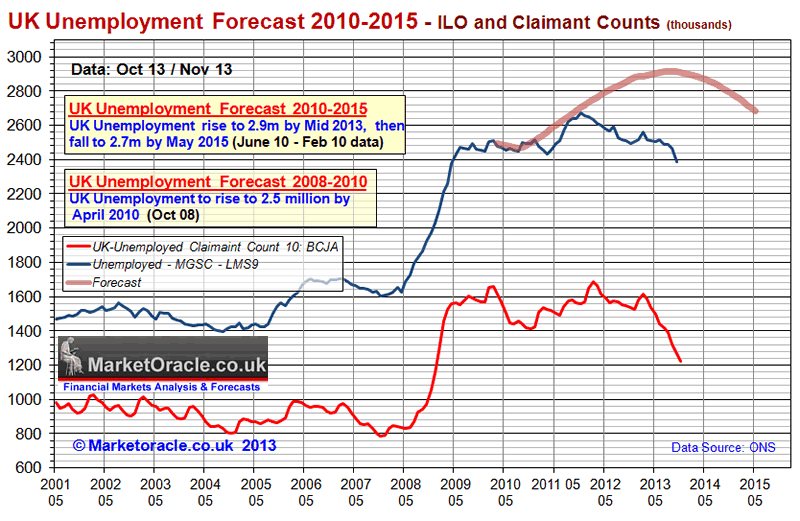
The following updated graph illustrates what has subsequently transpired in that UK unemployment did track my forecast for the first two years before starting to show significant divergence that on face value was a sign of relative economic strength but instead reflects the dual impact of the Coalition government stealthy abandoning the policies of austerity as evidenced by expansion of the budget deficit against forecast expectations. Something that both Labour and the Coalition government were happy to under play the significance of as both parties are invested in promoting the impacts of economic austerity. That and the trend for falling wages which encouraged employers to retain / employ workers on significantly less pay.
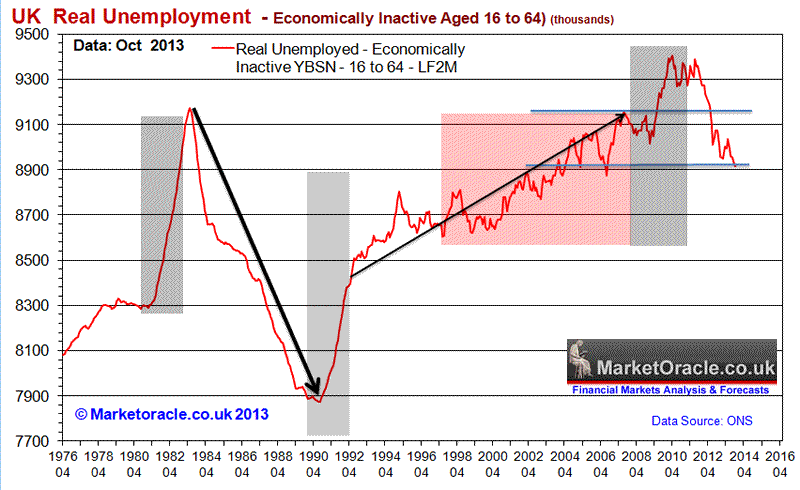
The positive UK unemployment trend has been further encouraged through a whole host of schemes such as the Bank of England's funding for lending scheme primarily for small businesses, full time workers converted to part time workers, about 1/2 million more self employed than there were in 2008, and that more than 1 million workers are now contracted under zero hours (up from 150,000 in 2010) that amount to a pools of virtual slave labour, workers who tend not to know if they will be working the following day until they receive a phone all or more usually the case a text message the evening before, and even then may find themselves rejected on arrival at work if the quota for workers has been fulfilled for that days shift work, or that their shift will end early on completion of the order, hence less pay as workers are only paid for hours actually worked. Real Unemployment is 5.5 Million Whilst the headline UK Unemployment rate peak of 2.7 million at 8.5% of the workforce is remarkably low when one compares it against past milder recessions had seen UK unemployment peak at much higher levels i.e. in the 1980's at 12% and in 1990 at 10.8%, therefore on face value the Labour government and then Coalition appeared to have achieved a minor miracle by UK unemployment peaking at only 8.5% in the midst of the worst recession since the Great Depression, which in reality was an 5-6 year economic depression. However, I have long questioned the accuracy and validity of the official unemployment data which over several decades and much manipulation by successive governments has been tweaked many hundreds of times to under report true unemployment for political purposes. Current official unemployment stands at 2.4 million which is set against the total recorded as economically inactive of working age that stands at near 9 million which illustrates the true extent of failure of the last Labour government to manage the potential of the work force during the boom years as illustrated by the fact that 80% of the 2.1 million jobs created under Labour went to foreign workers and therefore did nothing to address the true level of UK unemployment that contained a hidden ticking social security financing time bomb that we have seen explode as an extra £40 billion annual budget deficit.
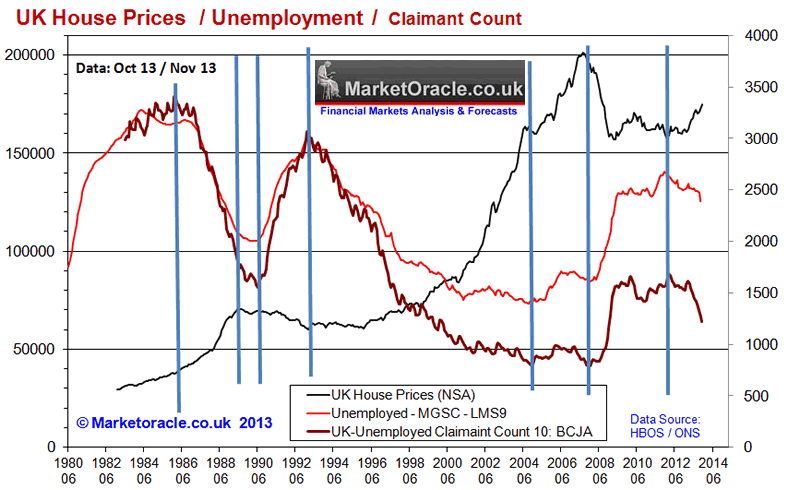
During the Conservative boom cycle, real unemployment fell from the 1983 crisis peak. However the same did not take place following the early 1990's recession where real unemployment failed to not only fall but steadily rose under Labours boom years as the benefits culture took hold as over 1 million foreign workers performed the jobs that unemployed Britain's were not prepared to do as they were far more comfortable living off tax payers as vested interests in Labours benefits for life culture, thus Labour engineered an extra 2 million positive voter balance i.e. 1 million more benefit claimants coupled with 1 million low paid immigrant workers that continued to increase long after the boom had ended. Whilst not all of the 9 million economically inactive are capable of seeking work, however the figure does imply that at least 3 million of the 9 million form the core of the what we all knows as the benefits culture i.e. the could work, won't work. Therefore the 3 million not counted in official unemployment numbers that choose not to work but instead prefer to rely on tax payer funded benefits added to the official 2.4 million unemployed results in a total UK unemployment count of 5.5 million. Which is more in line with the recession experience of other similarly in-debted and structured European countries such as Spain that has an unemployment rate of 26.7%, against Britains real unemployment rate of 18.3% or 30% when including all economically inactive of working age. The Conservative led coalition has so far only been partially successful in dismantling Labours benefits for life culture, as clearly the fall in real unemployment is nowhere on the scale of that which occurred following the early 1980's recession, when real unemployment was reduced by 1.2 million against just 500,000 during the past few years, implying that the Coalition has so far only done half the job of unraveling Labours pool of vested interest benefit claimers. The key message that this graph sends out is that no matter what propaganda Labour politicians spout their actions in government are always to increase the number of real unemployed because most of whom would be expected to vote Labour just as took place during the Blair boom years. In terms of house prices the next chart indicates that there does exist a strong relationship between house price trends and the unemployment claimant count, more so than that of official unemployment data which as the earlier analysis suggests does NOT reflect REAL unemployment. Which means that house prices can and have risen in the past whilst the official rate of unemployment rose if at the same time the claimant count did not rise.
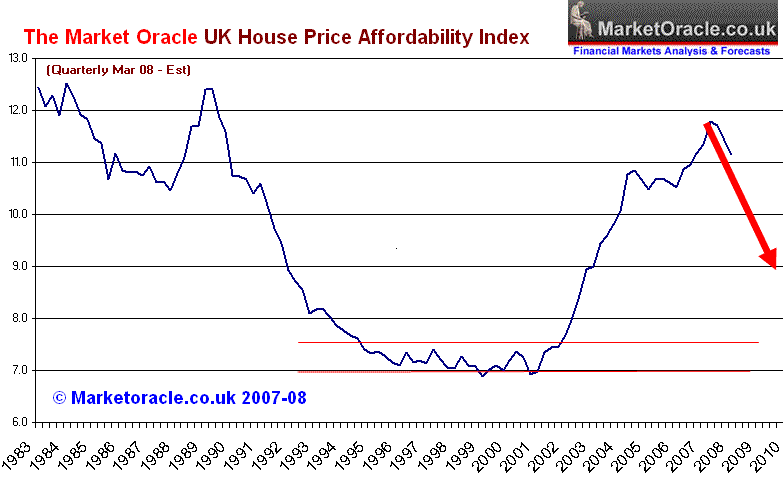
The current strong trend in falling claimant numbers is both a strong inverse relationship as well as a LEADING indicator for UK house prices trend trajectory. What this implies for 2014 at least and probably into the May 2015 general election is that house price inflation looks set to accelerate further and that it is highly probable that average UK house prices will hit a new all time high BEFORE the next general election, something that academics are not expecting until 2019! Therefore house prices at new all time highs will be a significant boost for the Conservatives in the run upto election day that will become the focal point for many commentators in the mainstream media as a sign that the UK economy had fully recovered following the depression of 2008-2013. This therefore reinforces my expectations that it is highly probable that the Conservatives will win a May 2015 general election despite Labour policies having engineered near 3 million extra vested interest voters during the past 15 years. In terms of sustainability for house price inflation beyond the next general election, this depends on total clamant count maintaining numbers below 1 million, which again appears a highly probable outcome for several years where the strength or weakness in house price gains during any one year would be dependant upon the oscillation in claimant count numbers around the 1 million mark. Current trend implies a dip below then a post election nudge above. UK House Price Affordability Index Most academic housing market commentators focus on the various measures of housing market affordability or rather in affordability as house prices despite the price crash never fell to the affordability levels of the early 1990's housing bear market bottom and therefore ivory tower academics continue to cling onto expectations of a further house prices crash so as the fit in with their theoretical models of where prices should bottom in terms of affordability that gets liberally regurgitated in the mainstream press, and looking at the graph below it really is very easy to be seduced by something that on first glance appears obvious that house prices really are nowhere near the affordability levels of the past therefore it is very, very easy to conclude in that house prices MUST fall! It is OBVIOUS, is it not ? But it is also WRONG! Affordability Trend Forecast Feb 2008 - UK House Prices on Target for 15% Fall Despite Interest Rate Cuts
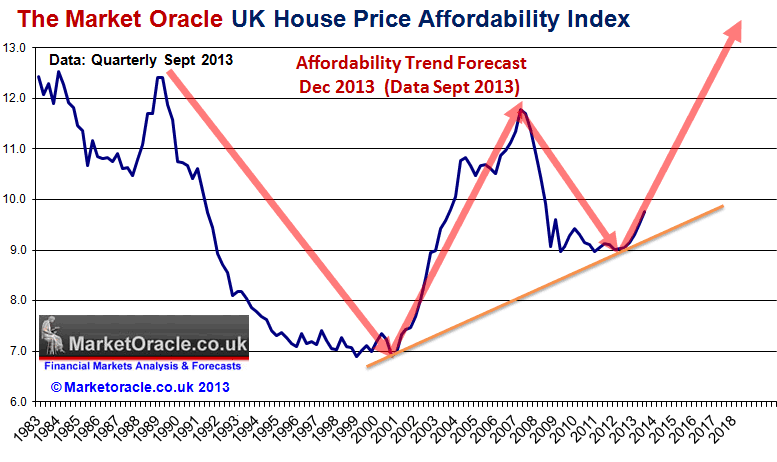
What the academics and mainstream press commentators fail to comprehend is TREND, or more precisely the TREND in AFFORDABILITY. The trend over the past 40 years has been for the proportion of earnings spent on housing costs to rise from 20% 40 years ago to an average of 35% today, which is trending towards 50% by 2030. This is the big story that academics have missed as over time, decades in fact people are becoming conditioned to spend more and more of their earnings on housing costs. Affordability Forecast - Dec 2013
The reason why affordability is expected to trend ever higher again has its roots in the exponential inflation mega-trend as workers relentlessly face a loss of purchasing power of earnings and savings due to reasons stated in this article such as the Inflation of the size of the population that is virtually WHOLLY as a result of IMMIGRATION, as evidenced by the baby boom now underway mostly amongst migrants of the past 13 years that acts to relentlessly put pressure on housing availability where annual construction (new builds) is not able to keep pace with even half of the new demand generated each year. Therefore workers have no choice but to commit an ever larger proportion of their earnings towards housing costs, the effect of which is that housing market affordability troughs are being ratcheted ever higher which leaves many clueless academics to ponder as to why they keep getting it wrong year after year, decade after decade as they persist in delusional states where their theoretical models that suggest house prices must fall that is completely contrary to that which takes place in the real world. The bottom line is that house prices are going to continue to get ever more expensive where those who are waiting for a further crash to become affordable will continue to regret not buying as the only way housing can even start to get more affordable is if the UK literally triples the number of new builds each year from approx 140,000 per year to 400,000, something that is just not going to happen as it would literally take the government undertaking to build a new city EVERY YEAR! Instead it has been over 40 years since the last city / town was built.
Note: This article is a cut down version of the that which is contained within the new UK House Prices Mega-trend Forecast 2014-2018 Ebook that will be published shortly and made available for FREE DOWNLOAD, Ensure you are subscribed to my always free newsletter to be notified of when available. The ebook covers all aspects of the UK housing market that goes beyond analysis towards the formulation of trend forecasts by including several housing market guides such as how to buy or sell properties, how to increase the value of your home, how to maintain and save money on running costs and more - ALL for FREE. Source and Comments: http://www.marketoracle.co.uk/Article44046.html Nadeem Walayat Copyright © 2005-2014 Marketoracle.co.uk (Market Oracle Ltd). All rights reserved. Nadeem Walayat has over 25 years experience of trading derivatives, portfolio management and analysing the financial markets, including one of few who both anticipated and Beat the 1987 Crash. Nadeem's forward looking analysis focuses on UK inflation, economy, interest rates and housing market. He is the author of five ebook's in the The Inflation Mega-Trend and Stocks Stealth Bull Market series.that can be downloaded for Free.
Disclaimer: The above is a matter of opinion provided for general information purposes only and is not intended as investment advice. Information and analysis above are derived from sources and utilising methods believed to be reliable, but we cannot accept responsibility for any trading losses you may incur as a result of this analysis. Individuals should consult with their personal financial advisors before engaging in any trading activities.
You're receiving this Email because you've registered with our website. How to Subscribe Click here to register and get our FREE Newsletter To access the Newsletter archive this link Forward a Message to Someone [FORWARD] To update your preferences [PREFERENCES] How to Unsubscribe - [UNSUBSCRIBE]
The Market Oracle is a FREE Financial Markets Forecasting & Analysis Newsletter and online publication. |
||||||||||||||||
© 2005-2022 http://www.MarketOracle.co.uk - The Market Oracle is a FREE Daily Financial Markets Analysis & Forecasting online publication.


 The continuing consequences of mass immigration has been one of depressing wages of all workers, hence immigration has been one of the primary reasons for the real terms fall in average earnings that looks set to resume AFTER the debt fuelled election boom into May 2015.