


Stock Market on Route to Recovery
Stock-Markets / US Stock Markets Apr 24, 2008 - 02:57 PM GMTBy: Clif_Droke

 By now it should be abundantly clear to even the most recalcitrant pessimists that the stock market is well along its route to recovery. The internal momentum structure hasn't looked this promising in weeks if not months. When it comes to evaluating the stock market's potential, internal momentum always precedes future price momentum and takes precedence over nearly every other consideration.
Using that truism as our starting point, let's examine the latest internal momentum pattern for the NYSE broad market. I am greatly encouraged by what I see in the 30-day, 60-day 90-day and 120-day dominant interim momentum indicators for the NYSE. Take a look at the HILMO (Hi-Lo Momentum) series below.
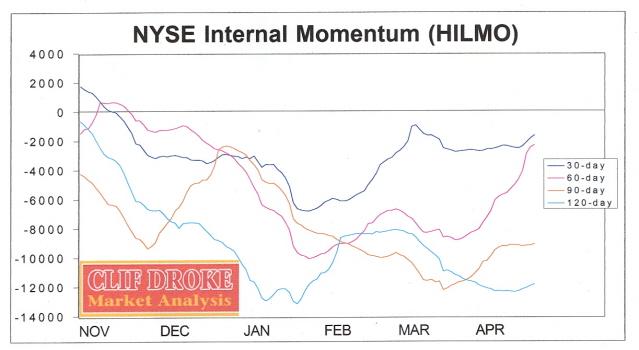
Do you see the upward turns in these highly important momentum indicators? Now can you remember a time when the Dow and S&P stock averages were above their rising 30-day, 60-day and 90-day moving averages? (Yes, I realize it strains the memory to think of such a time so long ago!) The point I'm trying to make here is that before you can see that beautiful upward curl in the 30/60/90-day moving averages for the major indices, you first have to see it unfold in the 30/60/90-day HILMO indicators. And it's unfolding now as I promised you it would several weeks ago! To me, it's simply a thing of beauty to watch unfold, much like watching the tulips slowly emerge from the snow-covered ground in early spring. Both serve as a reminder that the cold harshness of winter is gradually fading and giving way to the warmth and sunny freshness of spring. That's the pattern that's unfolding in the stock market today.
I could go on waxing poetic, but there is no need for that. The pictures are worth a thousand words and the above HILMO chart is all you really need to see to know that beneath the surface of this stock market, things are improving more and more each week. It won't be long now before eventually those individual stock prices start moving higher in response to the market's internal improvement.
A commonly heard statement among confused investors is, “I don't understand it! A few weeks ago, investors greeted bad news with selling and the major averages went lower. Now, bad news is greeted with buying and the indices completely ignore the bad news!”
The answer to this conundrum is simple. How the stock market responds to news (good or bad) is determined by internal momentum. When the market's main internal momentum gauges are up (as reflected in the rate of change of the number of stocks making net new highs), the market is more likely to respond to good news favorably and to ignore negative news. When the internal momentum is downward trending (as it was in December-January), the market is vulnerable to bad news.
The market's internal momentum structure is changing and is one reason why investors who are basing their investment decisions on the financial climate that prevailed in the previous few months are in for a lot of frustration.
From a news-tape reading standpoint, the latest shift in the market's reaction to bad news is a bullish sign that confirms the intermediate-term bottoming process we've been discussion over the last few weeks. A market that ignores bad news and instead pushes higher is a market that's internally strong. Internal strength gives way to external strength, which can be seen in the price line.
Once internal momentum translates into higher price momentum, as seen in the major stock market indices, then good news will actually start to become more common. Can you remember how long it has been since we heard any good news? I can't either!
Concerning the bank shares, to give you an idea of the technical situation in the banking stocks, take a look at the Regional Bank HOLDRS ETF (RKH). Notice that the selling pressure on each subsequent low since the mid-January bottom has occurred on lower trading volume. This shows that selling pressure has been diminishing and the sellers have lost their punch since January.
The March low in the RKH, although slightly lower than January's low in terms of price, occurred on less trading volume. The most recent low from the short-term cycle bottom this week happened on even lower trading volume. Selling pressure is drying up in the bank shares, and that's good news for the broad market since most of the financial troubles of the past few months have stemmed from this sector.
Then there's the matter of Wal-Mart (WMT), Fed-Ex (FDX) and the leading indicators of consumer and business sector strength. Both stocks have shown signs of strength, in the case of Wal-Mart the rally in the WMT chart has been huge! Check the daily chart and you'll see for yourself. In past periods of economic softness or even recession, a sustained rally in WMT has always meant that recovery is ahead for the consumer economy.
In the case of Fed-Ex, with this leading business transportation component of the DJTA turning around, can economic recovery be that far off for the U.S. business economy?
Then there's Big Blue. IBM, one of the leading components of the big cap stock universe, has been steadily making new 52-week highs. IBM recently broke out above a pivotal benchmark resistance level at 120 on high volume (18.95 million shares), providing even more confirmation that the stock market outlook is positive as we head further into spring.
What is even more constructive is the positive pattern in the Dow Jones Transportation Average (DJTA). The DJTA has been forecasting economic recovery ahead, for when the economic and oil-sensitive transportation stocks are able to make this much headway in past months despite the horrendous news and high oil prices during the first quarter, the forward-looking market is telling us that its sees better things on the horizon.
By Clif Droke
www.clifdroke.com
Clif Droke is the editor of the three times weekly Momentum Strategies Report newsletter, published since 1997, which covers U.S. equity markets and various stock sectors, natural resources, money supply and bank credit trends, the dollar and the U.S. economy. The forecasts are made using a unique proprietary blend of analytical methods involving internal momentum and moving average systems, as well as securities lending trends. He is also the author of numerous books, including "How to Read Chart Patterns for Greater Profits." For more information visit www.clifdroke.com
Clif Droke Archive |
© 2005-2022 http://www.MarketOracle.co.uk - The Market Oracle is a FREE Daily Financial Markets Analysis & Forecasting online publication.