


Why Government Cash Hand Outs Does Not Help Alleviate Poverty
Economics / Economic Theory Mar 16, 2014 - 02:28 PM GMTBy: Sam_Chee_Kong

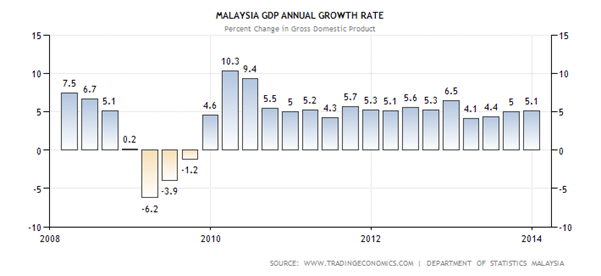
 The current rise in the cost of living in Malaysia can be attributed to the past policies of our Government. It can be traced back to the Global Financial Crisis in 2008. During that time a lot countries are badly affected and Malaysia is not spared either. The prices of commodities plunged due to reduced demand in the global marketplace. Since Malaysia’s economy depended much on commodity exports especially palm oil and rubber, it is badly affected. Malaysia’s economy recorded a 7.5% GDP growth at the beginning of 2008 but has since deteriorated to negative growth of 6.2% in 2009. This can be shown by the following graph.
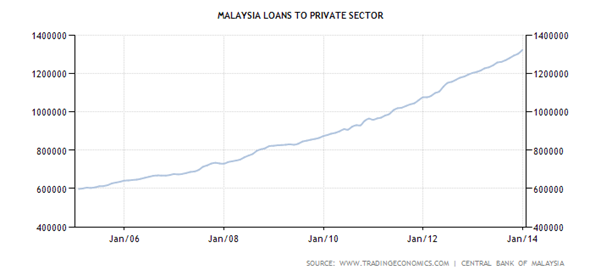
To prevent further slide of the economy, measures taken by our Government including flushing the economy with easy money by increasing the money supply. Procedures and regulations pertaining to Bank loans to the private consumers or business are relaxed. To boost the demand for houses and initiate a recovery in the housing sector, down payments are reduced to as low as 5%. In some cases, tenure of housing loans extended up to 45 years. Due to the availability of cheap credit, banks are also capitalizing by relaxing the requirements for personal loans and giving out credit cards to virtually anyone that needs it. People earning less than RM 3000 are able to obtain multiple credit cards from different banks. In short, a credit and debt bubble is created. Below is the chart for the loans to the private sector.
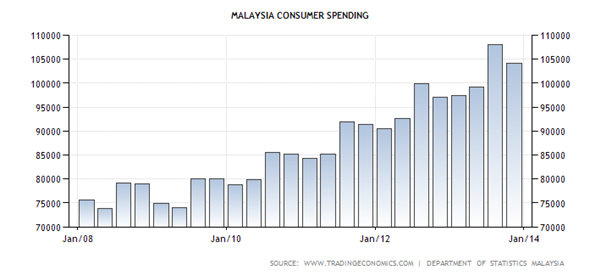
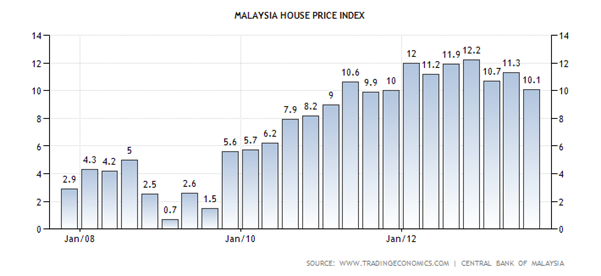
Due to the easy availability of credit, Malaysian consumers are led to the false assumption that the current good time is going to last forever. As a result, they splurge on both small and big ticket items such as cars, houses, luxury items such as handbags, designer clothes, shoes and etc. The following are the charts for the money supply, consumer spending and the housing index as of 2007 till 2014.
As a result of the easy availability of credit in the past and the lack of supervisory on the part of Bank Negara, this led to an enormous build-up of private sector debt. The following is the chart for the total debts by the private and Government sector as of 2011.
Debt |
Domestic |
Foreign |
Total |
Public |
438 |
18 |
456 |
Private |
749 |
239 |
988 |
Given the GDP of RM 860 billion we can then proceed to calculate the Debt/GDP ratio of both the public and private sector. The table below summarizes the ratio of domestic and foreign debts held by both the public and private sector.
Debt |
Domestic |
Foreign |
Total |
Public |
51% |
2% |
53% |
Private |
87% |
28% |
115% |
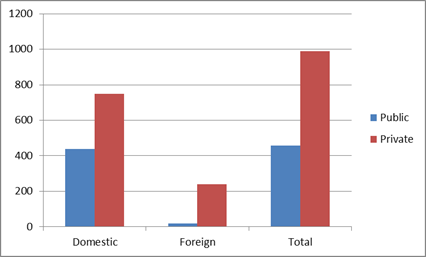
From the above we can conclude that at the present moment, the private sector poses a greater risk to financial default than the public sector. This is due to the fact that the private sector is much more exposed to any downside risk, arising not only from size of the debt (87%) but also its exposure to foreign debt (28% or $239 billion). Large exposure to foreign debt is risky because it is subjected to movements in foreign currency (US$ in this case) or external systemic market risk.
The movement of the US dollar creates currency risk or what we called ‘Foreign Exchange Exposure’ in Treasury terms. Foreign Exchange Exposure refers to the risk associated to a decline in a country’s currency. Currency depreciation can have the effect of reducing a company’s profits due to increased cost in imports or loss due to the higher repayments of loans denominated in US dollar.
How big a loss associated with currency movement depends on our Ringgit. On the negative node our country is also currently running ‘Twin Deficits’. Twin Deficits refers to a situation when our economy is facing two economic problems at the same time (Budget Deficit + Balance of Trade Deficit). Twin deficits are known to create havoc in an economy by accelerating the decline of a country’s currency and in this case the Ringgit. The following is the chart of the Ringgit since January 2008 until March 2014.
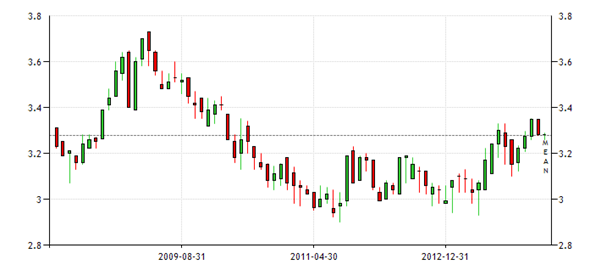
It can be seen that the pair USD/MYR has depreciated since 2012. The Ringgit is currently trading at 3.28 to the dollar which represents a 4 year low. So, obviously the risk of default in our private sector has certainly increased due to the problem currency depreciation.
As seen earlier, the credit expansion phase began in 2008 when our economy starts to contract. When our Government embark on an expansionary drive it will be very difficult to slow it down, without causing a deep contraction in the economy. By taking credit out of the economy will lead to a credit crunch that will reduce spending and eventually dampen the economic activity. Hence, in a Keynesian style economy, monetary injection may provide a quick recovery for a depressed economy but will not be sustainable in the long term. The economy will only grow as long as more credit is pumped into the economy. In other words, there is no EXIT strategy for an economy that thrived on continuous credit injection. This can be seen from the FED tapering recently. The reduction in credit injection from $85 billion to $75 billion then to $65 billion per month created chaos in the global financial markets. This is because the bulk of the funds (about $ 4 trillion) that went into the emerging markets are carry trade in nature. Carry trade is a situation where a fund manager arbitrage between the interest rate differential between countries. In this case fund managers from the U.S borrowed at rates close to zero (0.25%) and then invest into higher yield fixed income assets and equities in emerging markets such as Asia and Latin America.
Hence, fund managers are able to pocket the difference as long as the U.S interest rate doesn’t rise or Emerging Markets currencies doesn’t depreciate. In addition, such trades are very risky because they are highly leveraged meaning a small downturn in the exchange rate will wipe out the investors if they are not hedged. This actually what happens when the Fed starts tapering, interest rates surged due to the competition for credit. Hence, to prevent a profit turning into losses, fund managers began to repatriate their funds out of emerging markets. In fact there has been a steady net outflow of funds from emerging markets since 2011 as shown by the graph below.
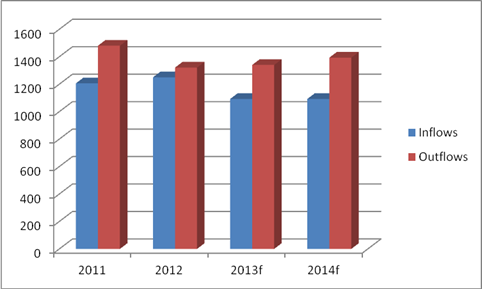
Source : IIF (institute of international finance) f = forecast
When funds are repatriated there will cause a net outflow of foreign currency and will lead to currency depreciations in the affected economies. To prevent further depreciation of their currencies, host countries began to hike interest rates so as to compensate foreign fund managers for keeping their currencies in the domestic economy. This is what actually what happened in the emerging market space last year. Central banks in Indonesia, India, South Africa and Turkey hiked their interest rates last year. This is not a long term solution because no country can survive high interest rates for long periods of time.
Malaysia took a different route, preferring to intervene in the foreign exchange market by selling US$, so as to prop up our Ringgit. But this is not a long term solution either because our Ringgit is considered a ‘MINOR’ currency as known in the foreign exchange market parlance. Minor currencies are normally besieged by low liquidity and high spreads due to the lack of interest among foreign exchange traders. Low liquidity also meant that minor currencies can be easily manipulated should there be an interest.
One of the reasons on why Malaysia maintained a huge foreign reserve is to be able to intervene in the foreign exchange market. Instead of using it to pay off our government debt of RM 528 billion, as derived from the following,
- GDP = $303.53
- Government Debt to GDP = 53.1%
- Exchange rate USD/MYR = 3.28
Total debt = ($303.53 x 3.28 x 0.531) or RM 528.65 billion.
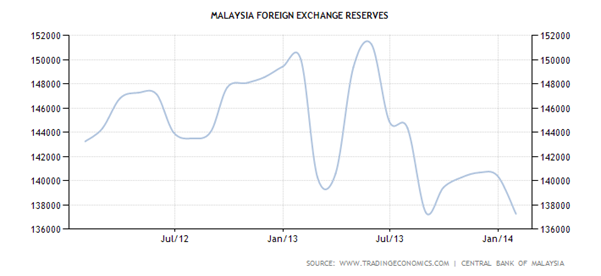
Our foreign exchange reserve peaked at $155 billion in August 2013 but has since dropped to $137 billion in January 2014. This can be shown by the following graph.
Further to that, credit contraction also meant the cost of funds will be more expensive due to the lack of availability. Interest rates will increase as a result and will cause havoc in the credit market. Real estate prices and stock prices will start to plunge due to the increased mortgage and margin loan payments. Thus any sensible government will do everything at its power to prevent any disruption in the economy. It will be more urgency for the Malaysian Government to address this problem due to the high level of debts held by the private sector.
To help its people to cope with the rising cost of living the Malaysian Government initiated the ‘cash aid’ policy. For the past couple of years we have seen an increasing amount of “cash aid” program dished out by our Government in the form BR1M. This was part of our Government’s GTP (Government Transformation Program) to lessen the burden of rising cost of living.
But will such a scheme help reduce the cost of living? Below I present to you the chart of Malaysia’s CPI.
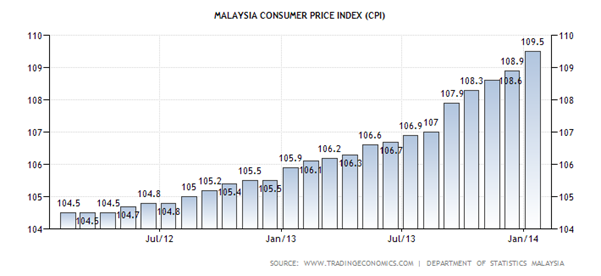
From above, it can be seen that since the launch of our Government’s BR1M cash aid in 2011, the cost of living in Malaysia has risen. The CPI index points went up from 104.5 in 2011 to 109.5 points in January 2014. Thus, Malaysians are worse off in terms of higher cost of living? Why is there a paradox? Isn’t financial aid from Government supposed to lighten the burden of the people? I shall address the problem in the following.
Paradox of Rising Prices
The CPI is one of the few measures of inflation and its value is derived by calculating the value of a basket of goods (basic necessities) from one period to another. It is also one of the most watched economic indicators by policy makers to micro manage their economies. If the economy is found to be overheated then a “tight money” regime will be implemented and interest rates will be increased so as to reduce spending. The reduction in spending will put downward pressure on prices of goods and services. A reversal policy is called for when economy is under performing. Below, I present you Dr Irving Fisher’s equation on price theory or exchange which is,
Fisher Equation of Exchange
MV = PT where,
M = Money Supply
V = Velocity
P = Price
T = Transaction or GNP (Gross National Product)
So from our equation above where MV = PT.
MV can also be defined as the total amount of money multiplied by the velocity of the money which is equal to the total dollar expenditure for current production. In short, it can be called Aggregate Demand. Similarly PT represents the average price of current production multiplied by the total physical volume of current production or also known as Aggregate Supply. As you can see from the algebraic equation MV = PT we can obtain the P by the following.
MV = PT
P = MV/T
As you can see the P can be influence by the three variables i.e, M,V and T
As you can see for P to increase either M or V will have to increase or T will have to reduce.
To put it in layman’s term, the following shows the cause and effect.
Causes Effect
+M → +P or,
+V → +P or,
-T → +P
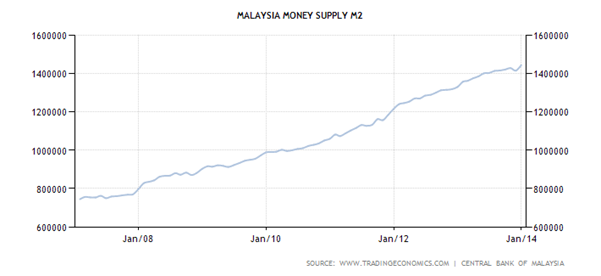
Since we know that the few rounds of RM 500 cash given out from BR1M scheme is an additional of new money into the system, thus will help ↑M and hence the Prices of goods and services with V and T being constant. We also know that T or the GNP (currently produced goods and services) did not increased, hence will not affect the P. So, now you can see that an increase in our country’s Money Supply will only help push up prices. The following chart is Malaysia’s Money Supply M2.
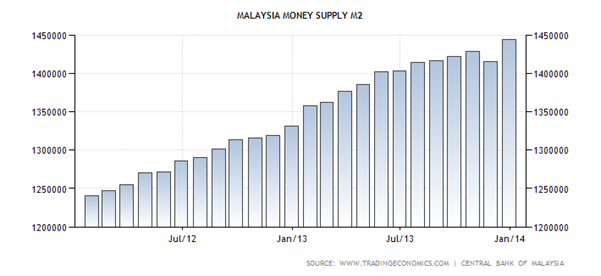
As shown from above our money supply increased from 1,240,000 MYR Million in January 2012 to 1,440,000 MYR Million in January 2014. This represents a 16.1% increased since January 2012. Thus, this help explains why cash hand-out by Governments is not necessarily a good policy to alleviate poverty. It might provide a short term relief to the people but in the long term it will lead to higher inflation and will further burden the people.
by Sam Chee Kong
cheekongsam@yahoo.com
© 2014 Copyright Sam Chee Kong - All Rights Reserved
Disclaimer: The above is a matter of opinion provided for general information purposes only and is not intended as investment advice. Information and analysis above are derived from sources and utilising methods believed to be reliable, but we cannot accept responsibility for any losses you may incur as a result of this analysis. Individuals should consult with their personal financial advisors.
© 2005-2022 http://www.MarketOracle.co.uk - The Market Oracle is a FREE Daily Financial Markets Analysis & Forecasting online publication.