


The DJIA Stock Market Index Is A Hoax
Stock-Markets / Stock Markets 2014 Mar 18, 2014 - 12:36 PM GMTBy: Wim_Grommen

 The Dow Jones Industrial Average (DJIA) Index is the only stock market index that covers both the second and the third industrial revolution. Calculating share indexes such as the Dow Jones Industrial Average and showing this index in a historical graph is a useful way to show which phase the industrial revolution is in. Changes in the DJIA shares basket, changes in the formula and stock splits during the take-off phase and acceleration phase of industrial revolutions are perfect transition-indicators. The similarities of these indicators during the last two revolutions are fascinating, but also a reason for concern. In fact the graph of the DJIA is a classic example of fictional truth, a hoax.
Transitions
Every production phase, civilization or other human invention goes through a so called transformation process. Transitions are social transformation processes that cover at least one generation. In this article I will use one such transition to demonstrate the position of our present civilization and its possible effect on stock exchange rates.
A transition has the following characteristics:
- it involves a structural change of civilization or a complex subsystem of our civilization
- it shows technological, economical, ecological, socio cultural and institutional changes at different levels that influence and enhance each other
- it is the result of slow changes (changes in supplies) and fast dynamics (flows)
A transition process is not fixed from the start because during the transition processes will adapt to the new situation. A transition is not dogmatic.
Four transition phases
In general transitions can be seen to go through the S curve and we can distinguish four phases (see fig. 1):
- a pre development phase of a dynamic balance in which the present status does not visibly change
- a take off phase in which the process of change starts because of changes in the system
- an acceleration phase in which visible structural changes take place through an accumulation of socio cultural, economical, ecological and institutional changes influencing each other; in this phase we see collective learning processes, diffusion and processes of embedding
- a stabilization phase in which the speed of sociological change slows down and a new dynamic balance is achieved through learning
A product life cycle also goes through an S curve. In that case there is a fifth phase:
- the degeneration phase in which cost rises because of over capacity and the producer will finally withdraw from the market.
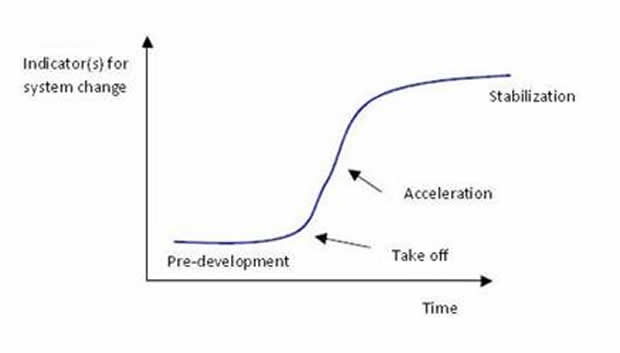
Figure 1. The S curve of a transition
Four phases in a transition best visualized by means of an S curve:
Pre-development, Take-off, Acceleration, Stabilization.
When we look back into the past we see three transitions, also called industrial revolutions, taking place with far-reaching effect :
1. The first industrial revolution (1780 until circa 1850); the steam engine
2. The second industrial revolution (1870 until circa 1930); electricity, oil and the car
3. The third industrial revolution (1950 until ....); computer and microprocessor
Dow Jones Industrial Average (DJIA)
The Dow Index was first published in 1896 when it consisted of just 12 constituents and was a simple price average index in which the sum total value of the shares of the 12 constituents were simply divided by 12. As such those shares with the highest prices had the greatest influence on the movements of the index as a whole. In 1916 the Dow 12 became the Dow 20 with four companies being removed from the original twelve and twelve new companies being added. In October, 1928 the Dow 20 became the Dow 30 but the calculation of the index was changed to be the sum of the value of the shares of the 30 constituents divided by what is known as the Dow Divisor.
While the inclusion of the Dow Divisor may have seemed totally straightforward it was – and still is – anything but! Why so? Because every time the number of, or specific constituent, companies change in the index any comparison of the new index value with the old index value is impossible to make with any validity whatsoever. It is like comparing the taste of a cocktail of fruits when the number of different fruits and their distinctive flavours – keep changing. Let me explain the aforementioned as it relates to the Dow.
The False Appreciation of the Dow Explained
On the other hand, companies in the take-off or acceleration phase are added to the index. This greatly increases the chances that the index will always continue to advance rather than decline. In fact, the manner in which the Dow index is maintained actually creates a kind of pyramid scheme! All goes well as long as companies are added that are in their take-off or acceleration phase in place of companies in their stabilization or degeneration phase.
On October 1st, 1928, when the Dow was enlarged to 30 constituents, the calculation formula for the index was changed to take into account the fact that the shares of companies in the Index split on occasion. It was determined that, to allow the value of the Index to remain constant, the sum total of the share values of the 30 constituent companies would be divided by 16.67 ( called the Dow Divisor) as opposed to the previous 30.
On October 1st, 1928 the sum value of the shares of the 30 constituents of the Dow 30 was $3,984 which was then divided by 16.67 rather than 30 thereby generating an index value of 239 (3984 divided by 16.67) instead of 132.8 (3984 divided by 30) representing an increase of 80% overnight!! This action had the affect of putting dramatically more importance on the absolute dollar changes of those shares with the greatest price changes. But it didn’t stop there!
On September, 1929 the Dow divisor was adjusted yet again. This time it was reduced even further down to 10.47 as a way of better accounting for the change in the deletion and addition of constituents back in October, 1928 which, in effect, increased the October 1st, 1928 index value to 380.5 from the original 132.8 for a paper increase of 186.5%!!! From September, 1929 onwards (at least for a while) this “adjustment” had the affect – and I repeat myself – of putting even that much more importance on the absolute dollar changes of those shares with the greatest changes.
How the Dow Divisor Contributed to the Crash of ‘29
From the above analyses/explanation it is evident that the dramatic “adjustments” to the Dow Divisor (coupled with the addition/deletion of constituent companies according to which transition phase they were in) were major contributors to the dramatic increase in the Dow from 1920 until October 1929 and the following dramatic decrease in the Dow 30 from then until 1932 notwithstanding the economic conditions of the time as well.
Dow Jones Industrial Index is a Hoax
In many graphs the y-axis is a fixed unit, such as kg, meter, liter or euro. In the graphs showing the stock exchange values, this also seems to be the case because the unit shows a number of points. However, this is far from true! An index point is not a fixed unit in time and does not have any historical significance. An index is calculated on the basis of a set of shares. Every index has its own formula and the formula gives the number of points of the index. Unfortunately many people attach a lot of value to these graphs which are, however, very deceptive.
An index is calculated on the basis of a set of shares. Every index has its own formula and the formula results in the number of points of the index. However, this set of shares changes regularly. For a new period the value is based on a different set of shares. It is very strange that these different sets of shares are represented as the same unit. In less than ten years twelve of the thirty companies (i.e. 40%) in the Dow Jones were replaced. Over a period of sixteen years, twenty companies were replaced, a figure of 67%. This meant that over a very short period we were left comparing a basket of today’s apples with a basket of yesterday’s pears.
Even more disturbing is the fact that with every change in the set of shares used to calculate the number of points, the formula also changes. This is done because the index, which is the result of two different sets of shares at the moment the set is changed, must be the same for both sets at that point in time. The index graphs must be continuous lines. For example, the Dow Jones is calculated by adding the shares and dividing the result by a number. Because of changes in the set of shares and the splitting of shares the divider changes continuously. At the moment the divider is 0.15571590501117 but in 1985 this number was higher than 1. An index point in two periods of time is therefore calculated in different ways:
Dow1985 = (x1 + x2 +..+x30) / 1
Dow2014 = (x1 + x2 +.. + x30) / 0.15571590501117
In the 1990s many shares were split. To make sure the result of the calculation remained the same both the number of shares and the divider changed. An increase in share value of 1 dollar of the set of shares in 2014 results is 6.4 times more points than in 1985. The fact that in the 1990s many shares were split is probably the cause of the exponential growth of the Dow Jones index. At the moment the Dow is at 16,437 points. If we used the 1985 formula it would be at 2,559 points.
The most remarkable characteristic is of course the constantly changing set of shares. Generally speaking, the companies that are removed from the set are in a stabilization or degeneration phase. Companies in a take off phase or acceleration phase are added to the set. This greatly increases the chance that the index will rise rather than go down. This is obvious, especially when this is done during the acceleration phase of a transition. From 1980 onward 7 ICT companies (3M, AT&T, Cisco, HP, IBM, Intel, Microsoft), the engines of the latest revolution and 5 financial institutions, which always play an important role in every transition, were added to the Dow Jones.
Dow Jones Industrial Average

Figure 2 Exchange rates of Dow Jones during the latest two industrial revolutions. During the last few years the rate increases have accelerated enormously.
Overview from 1997 : 20 winners in – 20 losers out, a figure of 67%
September 23, 2013: Hewlett – Packard Co., Bank of America Inc. and Alcoa Inc. will replaced by Goldman Sachs Group Inc., Nike Inc. and Visa Inc.
Alcoa has dropped from $40 in 2007 to $8.08. Hewlett- Packard Co. has dropped from $50 in 2010 to $22.36.
Bank of America has dropped from $50 in 2007 to $14.48.
But Goldman Sachs Group Inc., Nike Inc. and Visa Inc. have risen 25%, 27% and 18% respectively in 2013.
September 20, 2012: UnitedHealth Group Inc. (UNH) replaces Kraft Foods Inc.
Kraft Foods Inc. was split into two companies and was therefore deemed less representative so no longer suitable for the Dow. The share value of UnitedHealth Group Inc. had risen for two years before inclusion in the Dow by 53%.
June 8, 2009: Cisco and Travelers replaced Citigroup and General Motors.
Citigroup and General Motors have received billions of dollars of U.S. government money to survive and were not representative of the Do.
September 22, 2008: Kraft Foods Inc. replaced American International Group.
American International Group was replaced after the decision of the government to take a 79.9% stake in the insurance giant. AIG was narrowly saved from destruction by an emergency loan from the Fed.
February 19, 2008: Bank of America Corp. and Chevron Corp. replaced Altria Group Inc. and Honeywell International.
Altria was split into two companies and was deemed no longer suitable for the Dow.
Honeywell was removed from the Dow because the role of industrial companies in the U.S. stock market in the recent years had declined and Honeywell had the smallest sales and profits among the participants in the Dow.
April 8, 2004: Verizon Communications Inc., American International Group Inc. and Pfizer Inc. replace AT & T Corp., Eastman Kodak Co. and International Paper.
AIG shares had increased over 387% in the previous decade and Pfizer had an increase of more than 675& behind it. Shares of AT & T and Kodak, on the other hand, had decreases of more than 40% in the past decade and were therefore removed from the Dow.
November 1, 1999: Microsoft Corporation, Intel Corporation, SBC Communications and Home Depot Incorporated replaced Chevron Corporation, Goodyear Tire & Rubber Company, Union Carbide Corporation and Sears Roebuck.
March 17, 1997: Travelers Group, Hewlett-Packard Company, Johnson & Johnson and Wal-Mart Stores Incorporated replaced Westinghouse Electric Corporation, Texaco Incorporated, Bethlehem Steel Corporation and Woolworth Corporation.
Real truth and fictional truth
Is the number of points that the Dow Jones now gives us a truth or a fictional truth?
If a fictional truth then the number of points now says absolutely nothing about the state that the economy or society is in when compared to the past. In that case a better guide would be to look at the number of people in society that use food stamps today – That is the real truth
Wim Grommen is a guest contributor to http://www.FinancialArticleSummariesToday.com, “A site/sight for sore eyes and inquisitive minds”, and www.munKNEE.com, “It’s all about MONEY” of which Lorimer Wilson is editor.
© 2014 Copyright Wim Grommen - All Rights Reserved
Disclaimer: The above is a matter of opinion provided for general information purposes only and is not intended as investment advice. Information and analysis above are derived from sources and utilising methods believed to be reliable, but we cannot accept responsibility for any losses you may incur as a result of this analysis. Individuals should consult with their personal financial advisors.
© 2005-2022 http://www.MarketOracle.co.uk - The Market Oracle is a FREE Daily Financial Markets Analysis & Forecasting online publication.