Stock Market Top, Example of VIX ETF, TVIX to ride the Market Down
Stock-Markets / Stock Markets 2014 Mar 23, 2014 - 04:46 PM GMTBy: Thomas_Clayton
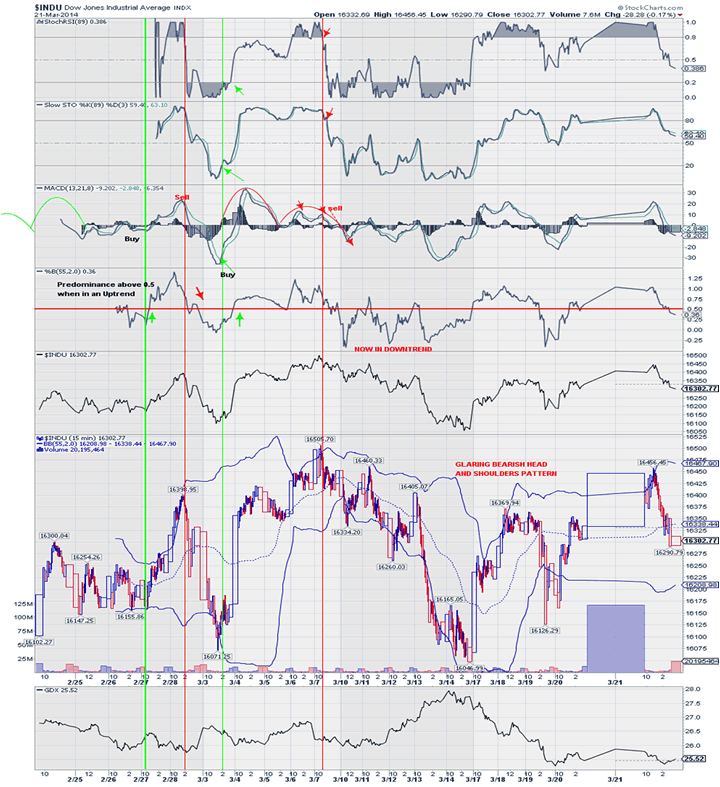
 DJIA. Huge non occurring volume at the Opening followed by meager volume and at Noon, the Bears decided to spank the Bulls.
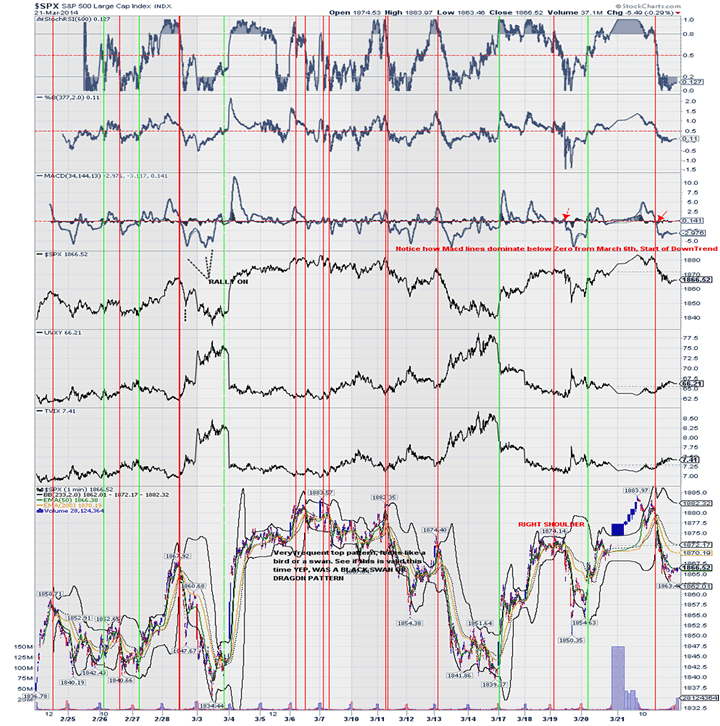
Standard and Poor 500 ..This is the Dialogue on my skype, stemsmexico3, on Friday with one of my Followers in Italy, who took positions in UVXY Thr and Fri. [21/03/2014 08:56:34 a.m.] claudio.: Sp500 don't want collapse!
[21/03/2014 09:00:44 a.m.] Clayton Tom: After 12 noon,,
[21/03/2014 11:00:05 a.m.] Clayton Tom: 12Noon SPX should start down and VIX Up
When MACD SPX is above Zero and not going higher, only path of least resistance is down+, See 12 noon on Chart.
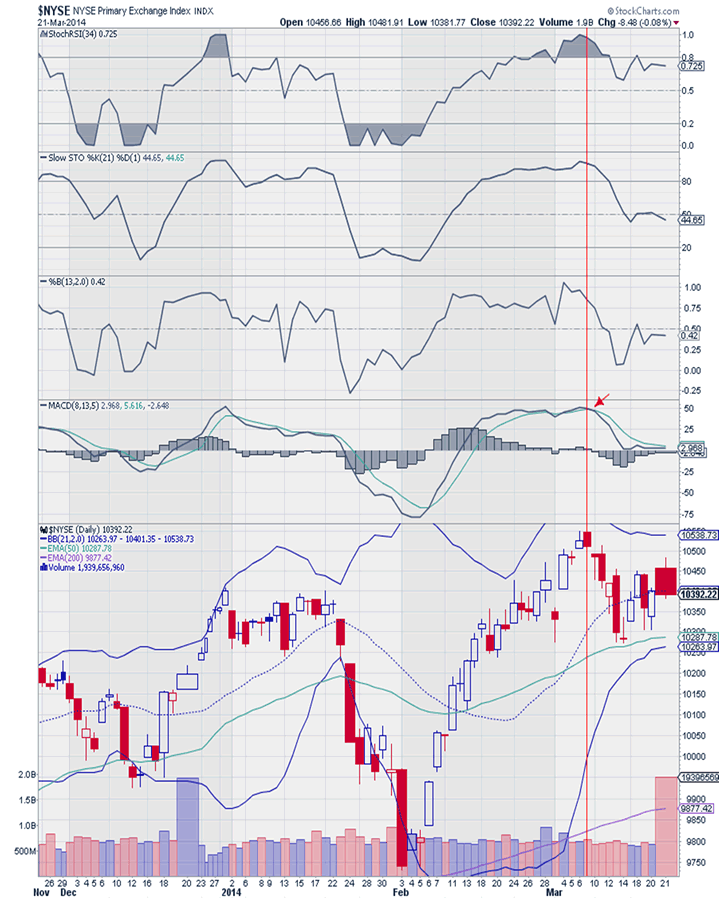
NYSE see the Volume Buy on Dec 20th and same Volume Sell Friday, March 21, March 7th, Dee TOP
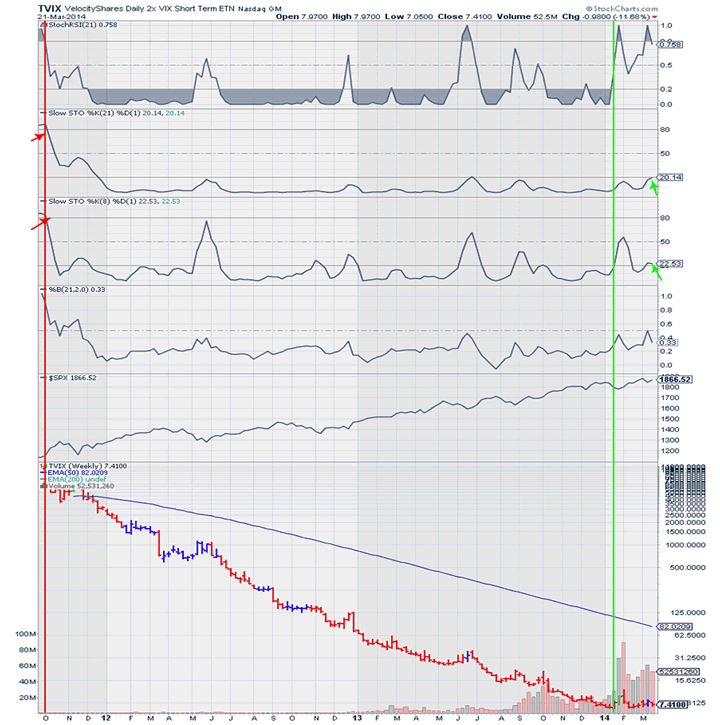
TVIX, The Volatility Index, which trades Inverseely to the SPX, Standard and Poor 500, The Last time the VIX Surged Up was back in May 0 2011, See the Blue Arrows, the same is happening right now. Prelude to a Massive Gain in VIX. When VIX can establish above $21, will be the start of a Massive acceleration to the Upside.
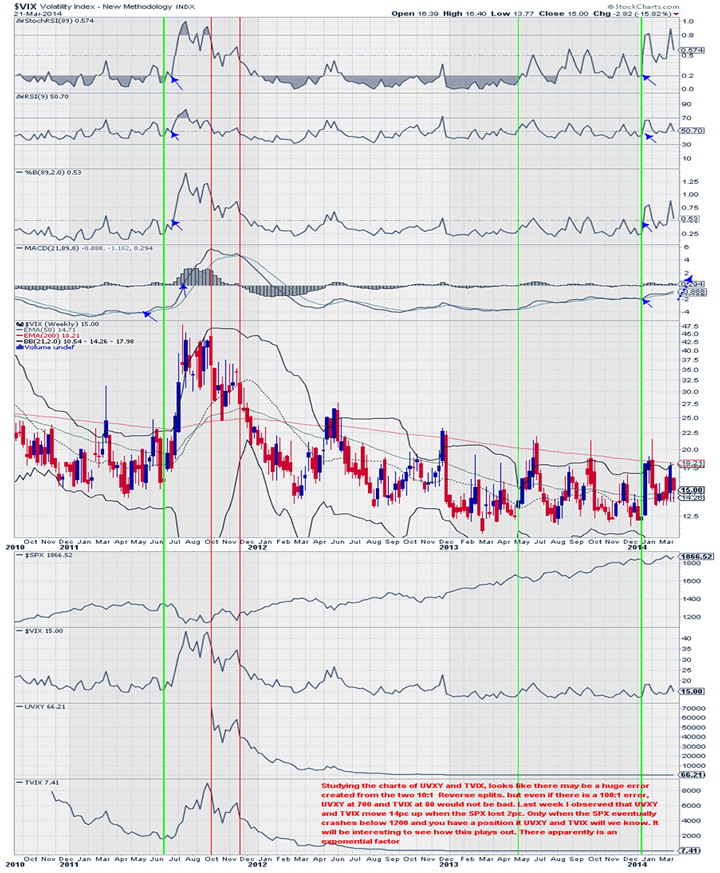
VIX is the function of ETF TVIX x 2. Weekly Chart..Start of Downtrend of TVIX and seems to be showing positive signs of a bottom and start of an Uptrend. TVIX seeems to be on the verge of a Massive Breakout to the Upside. Note the Stoch RSIis sustaining above 0.8 In the $7 range, TVIX offer minimal Risk with Massive Upside Potential
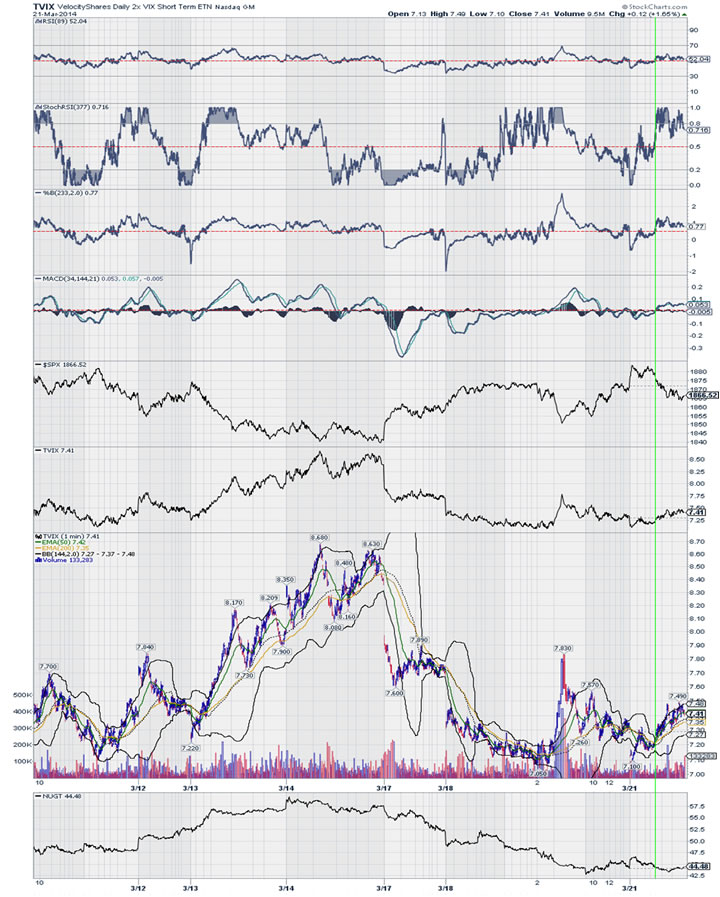
TVIX 1minute chart so you can see the Current Buy Signals triggered above the Red Line are the Triggers
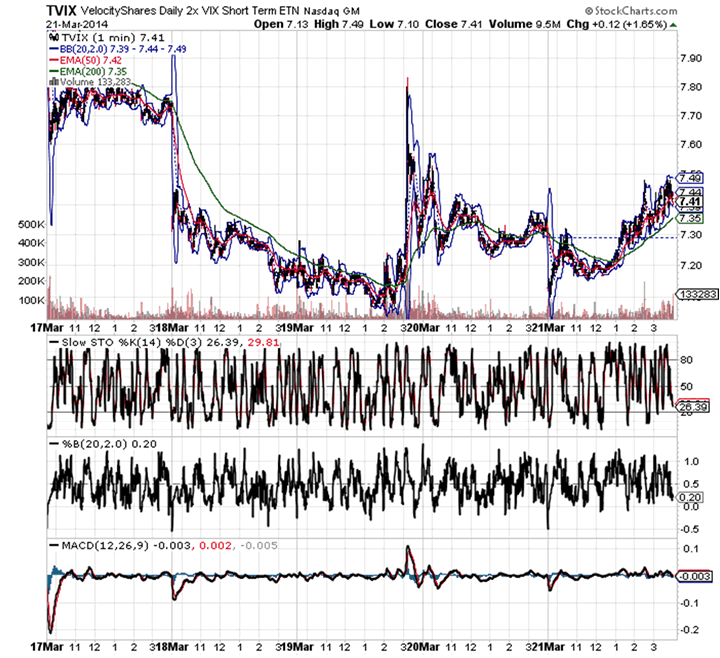
TVIX 1minute 5 days with Default Parameters given by stockcharts.com. I have taught myself how to manipulate the parameters to look like the chart above. So you can appreciate the work and hours gone into this to make the charts somewhat coherent and PRECISELY Accurate. I can tell you within hours and minutes what the Market will do now in many cases I can make tHe Indicators read upside down if I wish. This the same chart as above without the correct parameters. I have devised a Weapon of Massive Wealth here.
About the Author, Using my system at stockcharts.com, Public Chart Lists, Easy $$, by Clayton Tom, you will see the rest of my work in reference to Gold, Silver, NUGT, DUST, USLV, DSLV, etc SPX, $VIX, VXX, UVXY, etc UPRO, SPXU, ERX, ERY, DIG, DUG, FAS, FAZ, TNA, TZA, DRN, DRV and Winners of 2013, i.e. Pg 6, AAPL, GOOG, AMZN, PCLN, NFLX, FB, HLF (Hello, Mr Ackman) etc. You may ask me to do an Opinion based strictly on the Indicators I use. stemsmexico@gmail.com. I am an ex-broker, Asst. V.P. in Commodities with Dean Witter back in the late 1960s and early 70s and went through the exact training course as depicted in the movie, “Seeking Happyness” with Will Smith. I am also a retired Pharmacist via Cal Berkeley, U.C. School of Pharmaceutical Science and the mandatory Courses in Math has enabled me to understand the Derivation of the Indicators used to make this almost a perfect Technical means of precisely spotting Tops and Bottoms as a function of the Price Fluctuations of Stocks, ETFs, Currencies, Commodities and Financials Bond Instruments. I also lack just one semester for my MBA in Marketing at Univ. of Cal . SF State University. Retired after 25 years in Retail Pharmacy, rated as the most Competive Independent Pharmacy Chain in the Nation by the trade journal Pharmacy Times, 1995. Was the first Pharmacy in the U.S. to promote Generic Drugs in the early 1970s.
By Thomas Clayton
© 2013 Copyright Thomas Clayton - All Rights Reserved
Disclaimer: The above is a matter of opinion provided for general information purposes only and is not intended as investment advice. Information and analysis above are derived from sources and utilising methods believed to be reliable, but we cannot accept responsibility for any losses you may incur as a result of this analysis. Individuals should consult with their personal financial advisors.
© 2005-2022 http://www.MarketOracle.co.uk - The Market Oracle is a FREE Daily Financial Markets Analysis & Forecasting online publication.


