Gold Price Projection by the Golden Ratio
Commodities / Gold and Silver 2014 Mar 26, 2014 - 10:25 AM GMTBy: Trader_MC
 This article shows how Gold has been following the Golden Ratio which predicted all the major turning points with a high degree of accuracy for the past thirty years, and reveals the next possible major turning points. The Golden Ratio 1.618034… (also called the Golden Number, the Golden Section or the Golden Mean) can be found everywhere around us from mathematics to architecture, from nature to our own anatomy. But as you can see in the following analysis, it can also be found in the Gold Metal Charts.
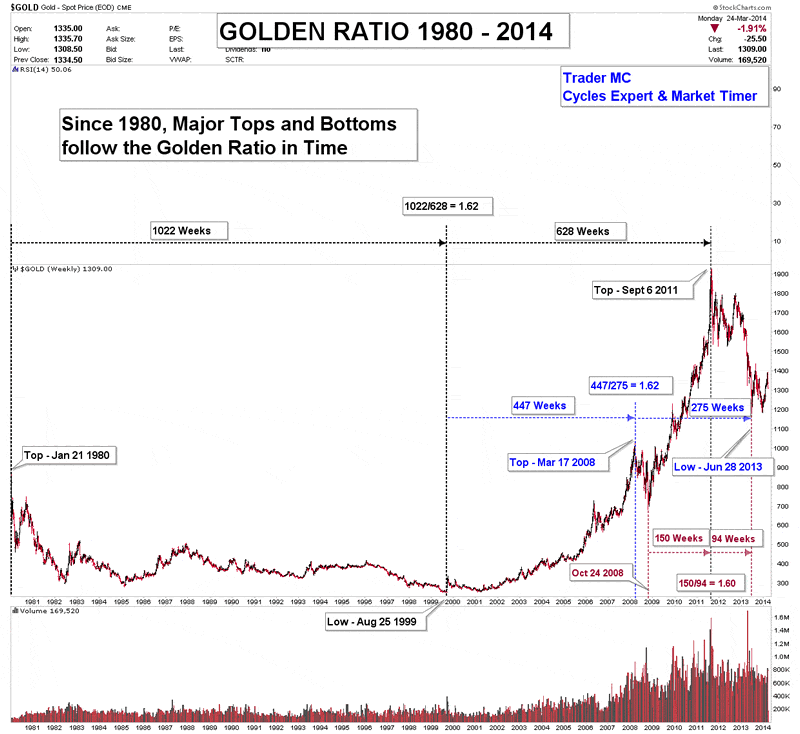
The first chart presents the Secular Bear Market from 1980 to 1999 and the Cyclical Bull Market from 1999 to 2011 and shows how they are connected to the Golden Ratio 1.618. Firstly, you can see that the three most important turning points (1980 top – 1999 low – 2011 top) had a time duration which is accurately connected to the Golden Ratio. It is also interesting to note that the Golden Ratio has an inverse correlation with the previous turning point (high-low-high).
Secondly, the first leg up of the Cyclical Bull Market from the low on August 25, 1999 to the top of March 17, 2008 predicted exactly the low on June 28, 2013. Here again, the Golden Ratio has an inverse correlation with the previous turning point (low-high-low).
Thirdly, the second leg up of the Cyclical Bull Market – from the low on October 24, 2008, to the top on September 6, 2011 – pinpointed also the low on June 28, 2013 and once again, the correlation is inverted (low-high-low).

The next chart shows the Cyclical Bear Market from the 2011 top to the 2013 low. A look at the time duration of the tops and lows of this bear market reveals that it has an inverse correlation with the Golden Ratio. Contrary to the bull market, the bear market follows the 0.62 ratio which is the inverse of the Golden Ratio (1/1.618=0.62). We can also notice that the alternate relation between highs and lows is broken (high-low-low).

As we can see, every turning point has been predicted by the Golden Ratio for the last thirty years. The charts are showing that these turning points did not happen by coincidence but followed a precise Golden Ratio road map. This ratio can therefore also be used to project the next important market turning points.
On the following charts you can see a projection upon studying the tops and lows of the previous bull and bear markets. The entire leg up of the Cyclical Bull Market from the low on August 25, 1999 to the top on September 6, 2011, is pinpointing an important market turn date during the last week of January 2019. As history has shown, the Golden Number had an inverse correlation with the previous tops or lows, so odds favor that the last week of January 2019 could be a major low which will be reversed by the September 6, 2011 high.

As for the Cyclical Bear Market from the 2011 high to the 2013 low, two possible turning points could be forecast, since I also take into account the Inverse Golden Ratio which pinpointed the highs and lows of the previous bear market.
We can see that the first turning point could happen during the first week of August 2014 (Golden Ratio) and the second one during the third week of May 2016 (Inverse Golden Ratio). Based on the Golden Ratio study, the first week of August 2014 could be a top, as the Golden Ratio sequence has usually an inverse correlation with the previous turning point (the low on June 28, 2013).
As for the third week of May 2016, history has shown that the Inverse Golden Ratio 0.62 keeps the same characteristic of the previous turning point. In that case the third week of May 2016 could be a low, as the previous turning point on 28 June, 2013 was a low.

However, it is important to note that the history also reveals that turning point sequences can be broken whether we are in a cyclical bull or a cyclical bear market. Therefore I think that the most important is to watch how the price action will approach these turning points (in an uptrend or in a downtrend) and be prepared for a trend change.
If the Golden Ratio has an important role for the time period, my analyses on Gold prices also reveals that prices of both legs up of the Cyclical Bull Market and of both legs down of the Cyclical Bear Market are connected to the Golden Ratio 1.618.
The Correlation of Price is a little less accurate than the one for Time Duration but it is still very relevant. A measure move with round numbers of the first leg up and the second leg up of the Cyclical Bull Market presents that both legs up have a price ratio of 1.59 which is very close to 1.618. The two legs down of the bear market are also very close to the Golden Ratio (7 points less than 1.62).

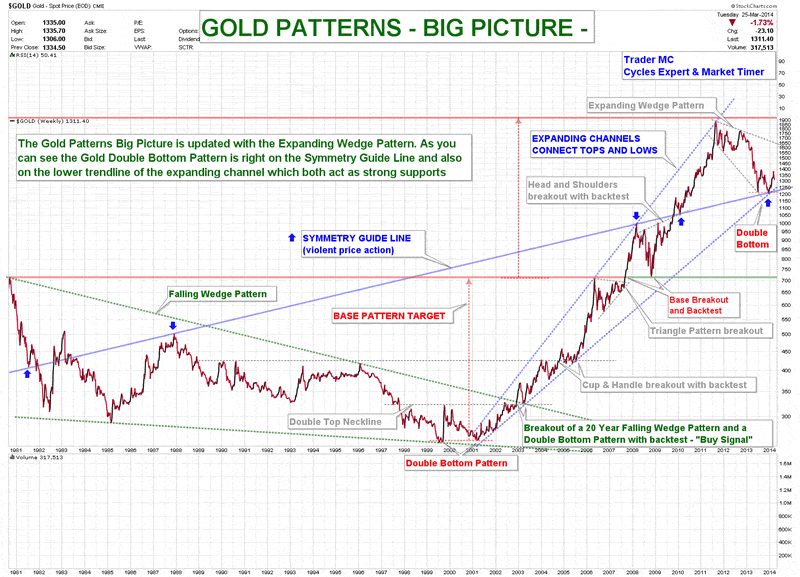
As far as Gold prices are holding above the Symmetry Guideline and Silver holds above its thirty years Base Pattern Neckline (as shown on the two charts below, also published in “2014 – The Year of Commodities“), the Secular Bull Market is still intact. In that case we could expect another leg up with a measure move between (the Golden Number) X (measure move of the Cyclical Bull Market) and (the Inverse Golden Number) X (measure move of the Cyclical Bull Market):
1.618 X (1921-252) = 2700
0.62 X (1921-252) = 1035
This leg up could therefore send prices to a range between $2215 and $3880 from the low at $1180. For the moment we need to see further development in the price action to confirm a new leg up.


As all the major turning points were predicted by the Golden Ratio both in terms of Price and Time, we can also note that Gold Time Duration is well balanced. The second leg up of the bull market lasted three times less that the first leg up, whereas the second correction lasted three times longer than the first one. The dynamic symmetry is therefore completed. The geometry of Time Dimension has an important role in the market structure, as the market likes geometry both in Price and Time.

The Golden Ratio has accurately predicted all the Gold major turning points these last thirty years and it seems reliable for making future projections. It is one of the techniques that can be used but the most important is to understand the structure and the rhythm of the market to forecast future developments not only in terms of the dimension of Price but also of the dimension of Time. In order to gain superior returns, it is essential to study the history of the market and to follow the price action.
Trader MC
Company: Cycle Trader MC OU
Web site: http://tradermc.com
Email: contact@tradermc.com
My analysis covers different assets – Market Indexes, such as US, Europe, Emerging Markets, China, Russia etc., Commodities, Currencies (Forex Trading), Bonds and Rates. In addition to the Markets Updates for MC Members, I also post real-time Trading Alerts for MC Leveraged Members for a more aggressive strategy in all the sectors. Besides the market analysis, this site also contains Cycles Count Updates for all Market Assets, including the Forex Market.
© 2014 Copyright Trader MC - All Rights Reserved
Disclaimer: The above is a matter of opinion provided for general information purposes only and is not intended as investment advice. Information and analysis above are derived from sources and utilising methods believed to be reliable, but we cannot accept responsibility for any losses you may incur as a result of this analysis. Individuals should consult with their personal financial advisors.
© 2005-2022 http://www.MarketOracle.co.uk - The Market Oracle is a FREE Daily Financial Markets Analysis & Forecasting online publication.


