


The Next Global Financial Crisis
Stock-Markets / Credit Crisis 2014 Mar 28, 2014 - 10:16 AM GMTBy: Clif_Droke

 Investors dodged another bullet recently as geopolitical instability temporarily subsided after Russia's annexation of Crimea. Although U.S. equities have experienced an internal correction since then, most of the damage has been relegated to over-extended tech stocks that were in need of a pullback.
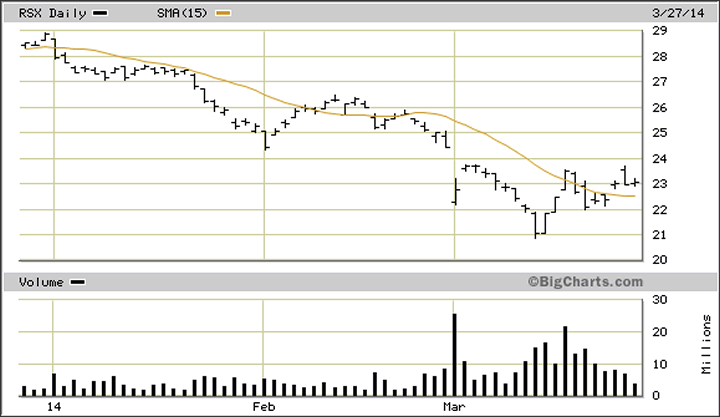
A reflection of the recent lifting of selling pressure on Russian equities can be seen in the daily chart for the Market Vectors Russia ETF (RSX), a proxy for Russia's stock market. RSX has rallied 10 percent off its year-to-date low and is now above the 15-day moving average to signal at least a temporary break of the immediate-term downtrend.
Wall Street's concern with China's slowing economy has also diminished from earlier this month and is reflected in the 4 percent rally of the Shanghai Composite Index recently. With China, Russia and the emerging markets on the backburner, equity investors should enjoy a temporary respite of worries until at least later this spring. While U.S. stocks are under mild selling pressure right now, the fact that the S&P 500 Index (SPX) is hovering close to its highs despite the correction in growth stocks suggests that the bulls haven't yet given up their control over the market. A "spring fling" to new highs can't be ruled out before the final descent of the long-term deflationary cycle makes its presence known.
Maybe not in the next couple of months, but certainly by the summer we should see signs of increasing market volatility and accelerating selling pressure, especially as we head closer to the final bottom of the 60-year deflationary cycle this fall. If China and/or other emerging market countries are experiencing turmoil at that time, it will only serve to exacerbate the volatility.
Speaking of China, it's worth noting that Goldman Sachs Group has warned that financing arrangements in China using commodities to obtain credit may unwind in the next 12 to 24 months. The unwinding would likely be driven by increased volatility in the yuan currency, according to Goldman. The unwinding would be bearish "given relatively limited physical liquidity to absorb the shock," Goldman's chief commodities analyst Jeffrey Currie wrote.
Already we've seen preliminary signs of what the next global market crisis could look like. The problems have originated in China and Russia with other countries (e.g. Brazil, Chile, Turkey) playing supporting roles. This is very similar to what happened in 1998 with the financial crisis that rolled across the globe beginning with Asia and extending to South America, Russia and finally hitting the U.S. like a tsunami. Few market analysts in 1998 (a super boom year) believed the "Asian contagion" would infect U.S. markets, but they were dead wrong. It happened very quickly in '98 with most of the damage occurring in July through September - the final "hard down" phase of the 4-year and 8-year cycles. Not coincidentally, 2014 is also a bottom year for the 4/8-year cycles as well as several others.
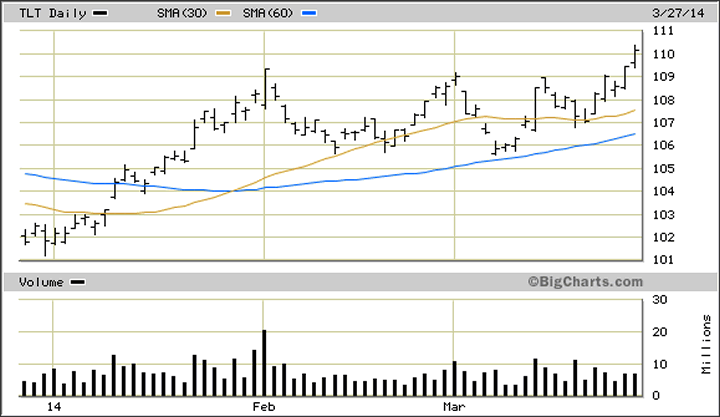
Also worth noting is the latest action in the bond market. In the Feb. 28 commentary entitled "The deadly undercurrent of deflation," we discussed buy signal for bonds confirmed by the Coppock Curve indicator for the iShares 20+ Year Treasury Bond ETF (TLT). The Coppock Curve is one of the single best indicators for issuing buy signals on bonds (though it is less helpful for determining tops). The Coppock Curve is derived by adding the 14-month and 11-month rate of changes for bond prices and smoothing the result with a 10-month weighted moving average.
As I wrote in the Feb. 28 commentary: "The recent Coppock Curve buy signal for bonds, assuming it pans out, means that Treasury yields will be declining while bond prices rise. Declining yields are very much consistent with the Kress cycle scenario for 2014, which suggests that disinflationary if not outright deflationary pressures will increase until the long-term cycles bottom later this year." While I don't expect selling pressure to be very strong against equities until after May, the fact that TLT broke out above an 8-month trading range ceiling this week is an indication that investors are becoming more concerned about deflation and its effects on global market volatility.
Contrary to Wall Street's expectations, global market volatility is still a prime consideration for stocks in the intermediate-term. China's slowing economy may come to exert a significant drag on global equities as the year progresses, and Russia will remain the proverbial powder keg until the Ukraine situation has been fully resolved. Until then, investors are advised to fasten their seatbelts as there will likely be increasing turbulence this summer.
Again, this summer the 4-year, 8-year, 10-year, 12-year, etc. cycles through the 60-year cycle will also be cascading into their final bottoms around late September/early October. It would be surprising indeed if the financial market somehow emerged unscathed by this crescendo, especially given the fragile state of the global economy.
Kress Cycles
Cycle analysis is essential to successful long-term financial planning. While stock selection begins with fundamental analysis and technical analysis is crucial for short-term market timing, cycles provide the context for the market’s intermediate- and longer-term trends.
While cycles are important, having the right set of cycles is absolutely critical to an investor’s success. They can make all the difference between a winning year and a losing one. One of the best cycle methods for capturing stock market turning points is the set of weekly and yearly rhythms known as the Kress cycles. This series of weekly cycles has been used with excellent long-term results for over 20 years after having been perfected by the late Samuel J. Kress.
In my latest book “Kress Cycles,” the third and final installment in the series, I explain the weekly cycles which are paramount to understanding Kress cycle methodology. Never before have the weekly cycles been revealed which Mr. Kress himself used to great effect in trading the SPX and OEX. If you have ever wanted to learn the Kress cycles in their entirety, now is your chance. The book is now available for sale at:
http://www.clifdroke.com/books/kresscycles.html
Order today to receive your autographed copy along with a free booklet on the best strategies for momentum trading. Also receive a FREE 1-month trial subscription to the Momentum Strategies Report newsletter.
By Clif Droke
www.clifdroke.com
Clif Droke is the editor of the daily Gold & Silver Stock Report. Published daily since 2002, the report provides forecasts and analysis of the leading gold, silver, uranium and energy stocks from a short-term technical standpoint. He is also the author of numerous books, including 'How to Read Chart Patterns for Greater Profits.' For more information visit www.clifdroke.com
Clif Droke Archive |
© 2005-2022 http://www.MarketOracle.co.uk - The Market Oracle is a FREE Daily Financial Markets Analysis & Forecasting online publication.