Interesting Stock Market Juncture
Stock-Markets / Stock Markets 2014 Mar 29, 2014 - 06:09 PM GMTBy: Tony_Caldaro
The market started the week opening higher, but then took on the character that had started on expiration Friday: sell growth stocks after the opening. During the week the market had three gap up openings, no gap downs, and still ended the week lower. For the week the SPX/DOW were mixed, the NDX/NAZ lost 2.5%, and the DJ World index rose 0.8%. Economic reports for the week remained positive. On the uptick: Q4 GDP, FHFA housing prices, consumer confidence/sentiment, durable goods orders, personal income/spending, PCE prices, the WLEI and weekly jobless claims improved. On the downtick: Case-Shiller, new/pending home sales and the M1-multiplier. Next week we get a look at the monthly Payrolls, ISM and Auto sales. Best to your week!
LONG TERM: bull market
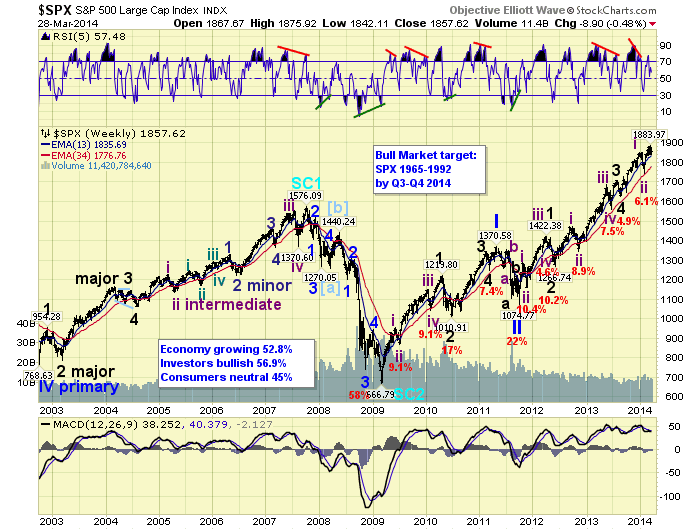
We continue to count this five year bull market as Cycle wave [1] of the next Super cycle bull market. Cycle wave bull markets unfold in five Primary waves. Primary waves I and II completed in 2011. Primary wave III has been underway since then. Primary wave I divided into five Major waves with a subdividing Major wave 1. Primary III is also naturally rising in five Major waves, but both Major waves 1 and 3 subdivided. Currently it appears Major wave 5 is also subdividing into five Intermediate waves. Not at all unusual for a third wave.

Major waves 1 and 2 of Primary III completed by mid-2012, and Major waves 3 and 4 by mid-2013. Major wave 5 has been underway since then. When Major wave 5 does complete, some time this year, Primary III will end. This should be followed by a substantial correction for Primary IV, probably coinciding with the 4 year Presidential cycle low scheduled for this year. This cycle typically bottoms in July or October. Then when Primary IV ends the market will rise again to new highs in a Primary wave V.
MEDIUM TERM: uptrend weakening
We have reached an interesting juncture in this bull market. As reported in recent weeks the cyclical/growth sectors have been out of sync for a number of months. This week it appeared they are trying to realign again. This would be good news for those who follow OEW analysis. When the four major indices are in sync, it is so much easier to track even the smallest of waves.
Currently we see three potential scenarios, in order of preference, short term. One: the NDX/NAZ confirm a downtrend next week, bottom within a few days, then all four major indices are aligned for the next wave up. Two: the NDX/NAZ is currently bottoming, with no downtrend confirmation, and all four major indices remain out of sync for the next wave up. Three: the situation in Ukraine/Russia worsens resulting in a panic selloff in equity markets, and all four major indices realign at the early February lows. Since we are basically of the “glass is half full mindset”, we will detail the implications of scenario number one.

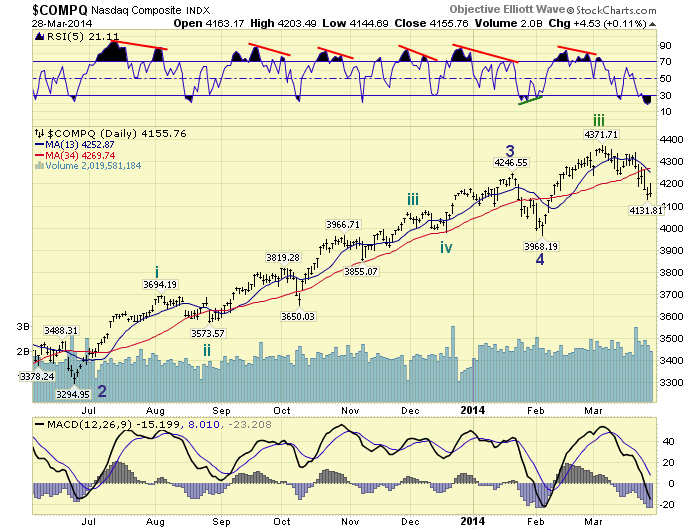
As noted in recent weeks the DOW and the NDX/NAZ have been the drivers of this bull market. The SPX is the traders preferred index, but it is basically a hybrid of growth and cyclical issues. The NDX/NAZ as represented by the NAZ chart above, still needs two more uptrends before it can complete Primary wave III. The high at NAZ 4372 in early March appears to be the end of its Intermediate wave iii. An Intermediate wave iv downtrend appears to be underway, and could bottom as early as next week. Should this occur, then the NDX/NAZ need to complete two more uptrends (Major 3 and Major 5) to complete Primary III.

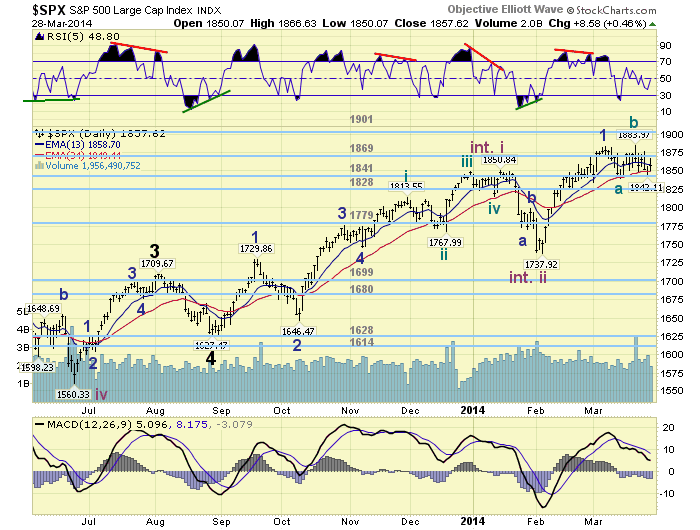
Should the SPX/DOW not confirm a downtrend while this is occurring. Then they too would only need to complete two more uptrends (Int. iii and Int. v) to complete Primary III. Then all four major indices should remained aligned for the duration of this bull market. Quite an interesting time. If we rule out the sort of ‘black swan’ Ukraine/Russia scenario, we have two scenarios suggesting the market is quite close to an important low. Major wave 3 in the NDX/NAZ, and Int. wave iii in the SPX/DOW could be quite powerful. Our attention will continue to be on the NDX/NAZ next week. Medium term support is at the 1841 and 1828 pivots, with resistance at the 1869 and 1901 pivots.
SHORT TERM
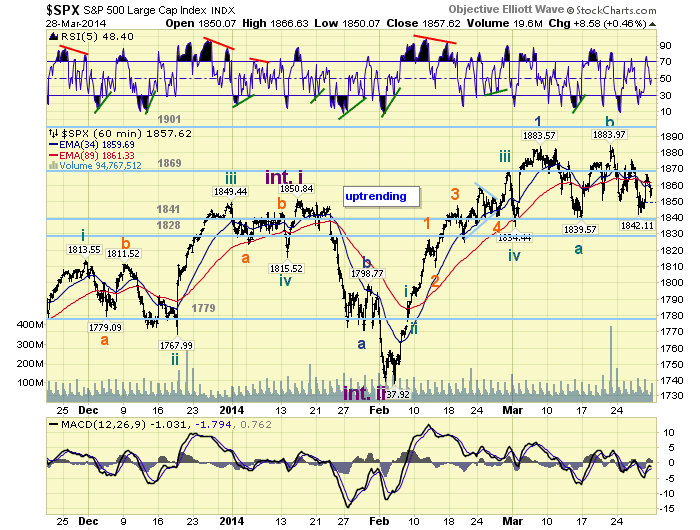
Short term support is at the 1841 and 1828 pivots, with resistance at the 1869 pivot and SPX 1884. Short term momentum ended this volatile week at neutral. The short term OEW charts are negative with the reversal level at SPX 1860.
During the week we spent most of the time elaborating on what was going on in this choppy market rather than detailing the waves. We noted the four consecutive days of higher openings, then growth stock selling within/after the first hour of trading. This started last Friday and continued until this Friday. From the early March highs the NDX/NAZ have dropped about 5.5%, while the SPX/DOW have declined only about 2.5%. While this was all transpiring we were doing some research and reviewing the charts.

Friday we updated the SPX hourly/daily charts to display a five wave Minor wave 1 high at SPX 1884. What followed appears to be an ongoing Minor wave 2 flat: 1840-1884-1842 so far. When we first started counting this uptrend we counted the pullback (1788-1777) as a wave. Then we got off it because it did not meet some parameters, and the market was quite choppy. After further review it appears the first impression was the correct one. This count suggests a flat is unfolding between the Minute iv low (1834) and the Minute v high (1884). Exactly what one would expect if a market is basing before moving higher, after a very strong and quick beginning.
FOREIGN MARKETS
The Asian markets were mostly higher on the week for a net gain of 1.8%.
The European markets were mostly higher for a net gain of 1.7%.
The Commodity equity group were also mostly higher for a net gain of 3.0%.
The DJ World index is still uptrending and gained 0.8%
COMMODITIES
Bonds remain in a downtrend but gained 0.2% on the week.
Crude is still in an uptrend and gained 2.1% on the week.
Gold has yet to confirm a downtrend and lost 3.0% on the week.
The USD is trying to uptrend and gained 0.1% on the week.
NEXT WEEK
Monday: Chicago PMI at 9:45 and a speech from FED chair Yellen at 9:55. Tuesday: ISM manufacturing, Construction spending and Auto sales. Wednesday: the ADP index and Factory orders. Thursday: weekly Jobless claims, the Trade deficit, and ISM services. Friday: the Payrolls report. Best to your weekend and week!
CHARTS: http://stockcharts.com/public/1269446/tenpp
http://caldaroew.spaces.live.com
After about 40 years of investing in the markets one learns that the markets are constantly changing, not only in price, but in what drives the markets. In the 1960s, the Nifty Fifty were the leaders of the stock market. In the 1970s, stock selection using Technical Analysis was important, as the market stayed with a trading range for the entire decade. In the 1980s, the market finally broke out of it doldrums, as the DOW broke through 1100 in 1982, and launched the greatest bull market on record.
Sharing is an important aspect of a life. Over 100 people have joined our group, from all walks of life, covering twenty three countries across the globe. It's been the most fun I have ever had in the market. Sharing uncommon knowledge, with investors. In hope of aiding them in finding their financial independence.
Copyright © 2014 Tony Caldaro - All Rights Reserved Disclaimer: The above is a matter of opinion provided for general information purposes only and is not intended as investment advice. Information and analysis above are derived from sources and utilising methods believed to be reliable, but we cannot accept responsibility for any losses you may incur as a result of this analysis. Individuals should consult with their personal financial advisors.
Tony Caldaro Archive |
© 2005-2022 http://www.MarketOracle.co.uk - The Market Oracle is a FREE Daily Financial Markets Analysis & Forecasting online publication.


