


Institutional Index Stocks Index Suggests Weakness Ahead for Broader Market
Stock-Markets / US Stock Markets Apr 28, 2008 - 03:25 PM GMTBy: Marty_Chenard

 This long term view of the Dow, Transports, and Institutional Index
tells you where the market is now.
This long term view of the Dow, Transports, and Institutional Index
tells you where the market is now.
Bull and Bear markets have one thing in common ... Bull markets move up in a long term up channel, and Bear markets move down in a long term down channel.
This morning, we will look at the long term channels on the Dow, the Transports and the Institutional Index.
Chart 1: Our first chart shows the 5+ year view of the Dow Jones Industrials.
Note how the Dow has moved in an up channel from 2003 to 2007. However, in January of this year, the Dow broke below its 5 year Bull channel.
After that break down, it has managed to rise up back into its channel. At this point, there is a positive and a negative.
The positive: The Dow is within its channel AND it just broke above its inter-channel resistance line. That favors more up movement on the short term.
The negative: The Dow is still in a technical down trend. Why? Because since last October, it has consistently made lower/tops and lower/bottoms.
What would be required for this to change back into a Bull market condition? From a technical basis, the Dow would have to make a higher/top followed by a higher/bottom and then move to a confirming higher top.
Is it clear sailing to the upside now? The answer is no, because we have an unresolved problem. The Dow made a Head & Shoulders pattern at its peak. The downside projection for the Head & Shoulders was never reached ... it remains an unresolved issue. For a completion of the pattern, the Dow should have fallen to 11400 or lower. That means that there is a high probability that the Dow will revisit this unresolved problem in the future.
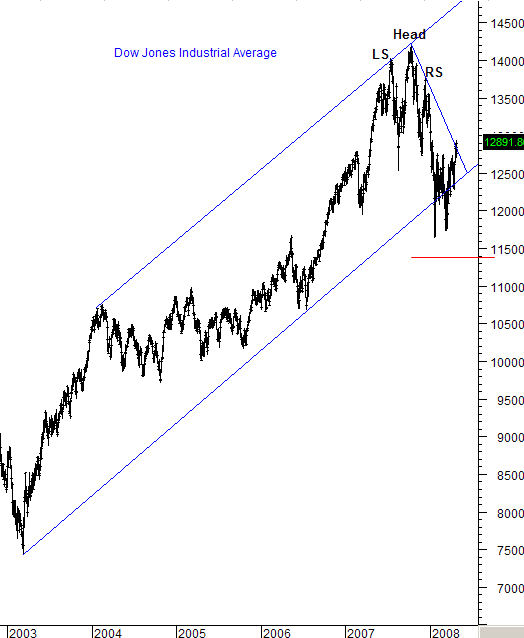
So the Dow is back within its channel for now.
What about the Transportation Index?
Chart 2: It also shows that it broke below its 5 year channel to the downside. The difference here, is that the Transports did not make it back into its channel.
Where is it now? On Friday, the Transports closed at its critical testing level for the channel. It closed right at the 5 year resistance. So, this is its big test this week ... and the Fed's interest rate announcement on Wednesday will play a critical role in whether or not the Transports rise back into its 5 year channel.
![]()
One more chart ...
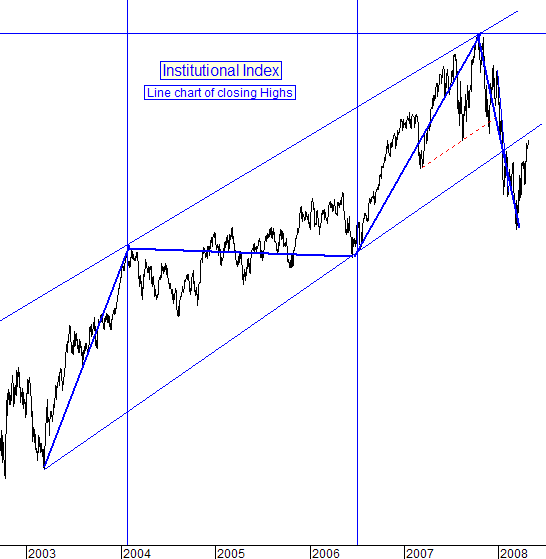
Chart 3: This next chart shows the Institutional Index and the action of its "core holdings" over the same period of time. This is an important index to watch in conjunction with the Dow and Transports because over half of the stock market's volume comes from Institutional investors.
So, what is the Institutional Index showing?
The picture here is similar to the Dow and the Transports, in that it has been rising in the past few weeks.
However, the Institutional "core holdings" Index has NOT made it back into the channel ... and it is NOT yet testing its channels bottom resistance line like the Transports yet.
This lagging weakness on the Institutional core holdings is a concern because their stocks should be leading the market's action and not trailing it.
By Marty Chenard
http://www.stocktiming.com/
Please Note: We do not issue Buy or Sell timing recommendations on these Free daily update pages . I hope you understand, that in fairness, our Buy/Sell recommendations and advanced market Models are only available to our paid subscribers on a password required basis. Membership information
Marty Chenard is the Author and Teacher of two Seminar Courses on "Advanced Technical Analysis Investing", Mr. Chenard has been investing for over 30 years. In 2001 when the NASDAQ dropped 24.5%, his personal investment performance for the year was a gain of 57.428%. He is an Advanced Stock Market Technical Analyst that has developed his own proprietary analytical tools. As a result, he was out of the market two weeks before the 1987 Crash in the most recent Bear Market he faxed his Members in March 2000 telling them all to SELL. He is an advanced technical analyst and not an investment advisor, nor a securities broker.
Marty Chenard Archive |
© 2005-2022 http://www.MarketOracle.co.uk - The Market Oracle is a FREE Daily Financial Markets Analysis & Forecasting online publication.