Manipulated Stocks Markets And The Empty Bag
Stock-Markets / Market Manipulation Apr 12, 2014 - 10:40 AM GMTBy: Raul_I_Meijer
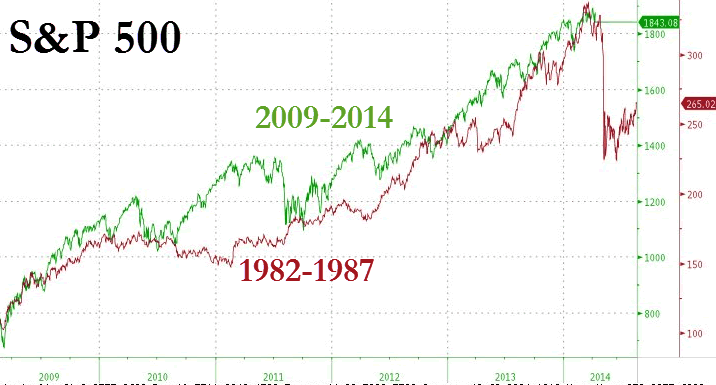
 Well, stocks are down substantially over the past few days, with internet and biotech taking big hits, and we see people like Marc Faber and Dennis Gartman urging people to get out of stocks. Something’s definitely going on. Time for a bunch of charts. And let’s start with a few of the comparison ones that everybody loves to hate, where you overlay when time period on another, and suggest similarities between both periods. This first one was used by Tyler Durden as an illustration for Marc Faber’s latest doom message. By the way, Faber says the markets are figuring out that the Fed is clueless, and I’m not so sure about that, I think it’s more likely that the Fed is not trying to do what it says it is, and that what it does try it does very well. And if that includes a stock market bust, it won’t hesitate. But so, here’s 1987 and 2014:
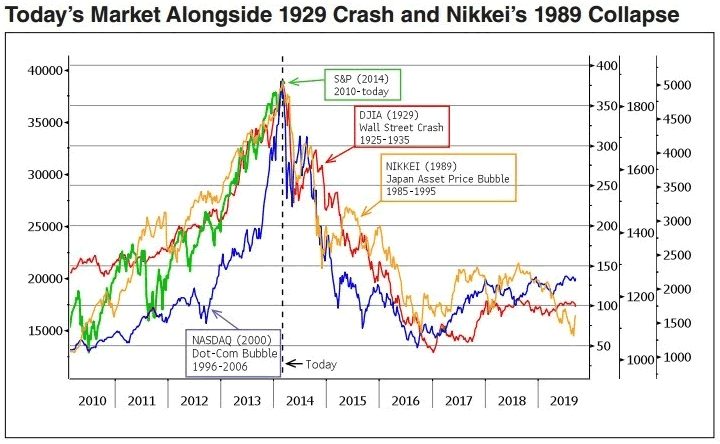
Personally, I’m kind of partial to this one, which “compares” the crashes of 1929 and 1989 to today, and I apologize for forgetting where I found it:
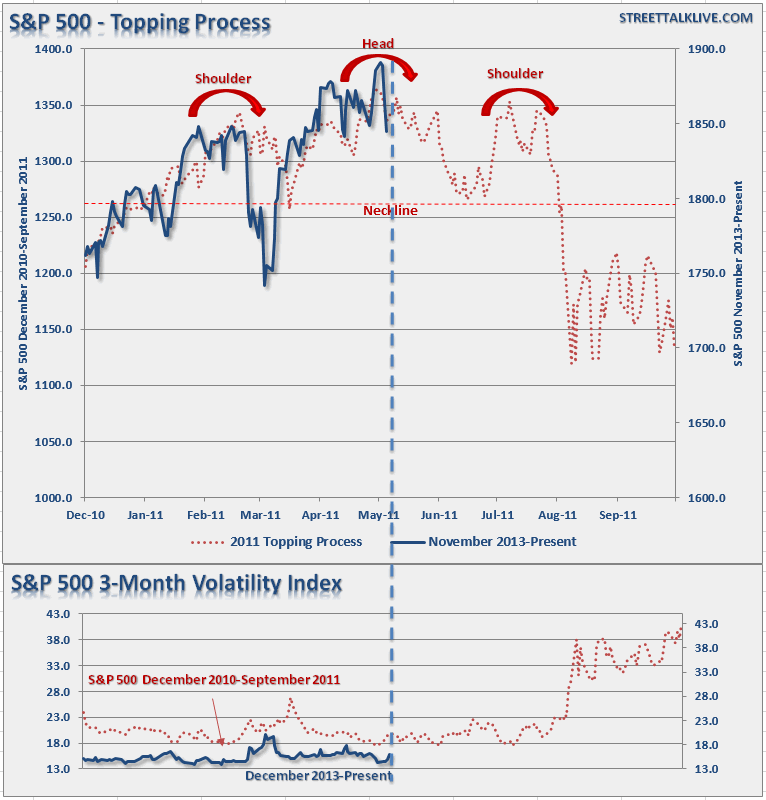
This one from Lance Roberts is not bad at all. Head and shoulders patterns can be very tempting:
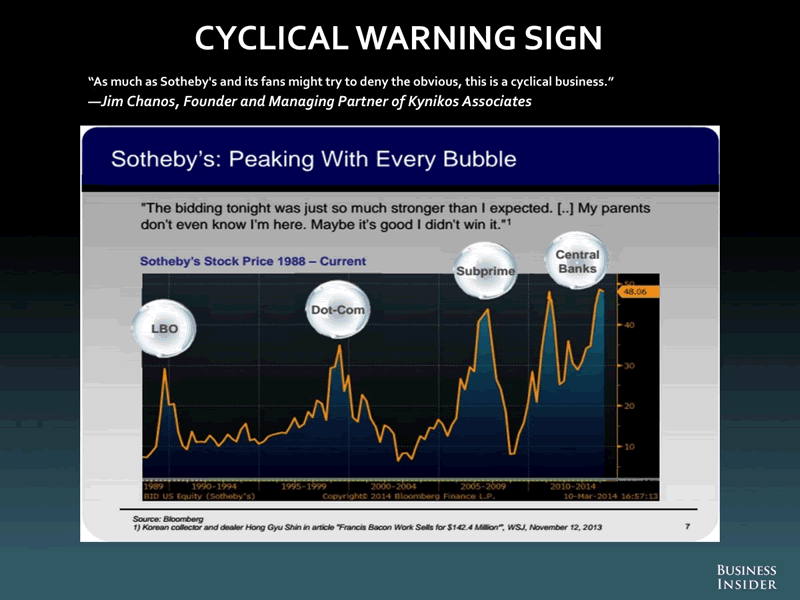
And I do like the suggested link between Sotheby’s stock price and market crashes Jim Chanos put in this graph that BI published:
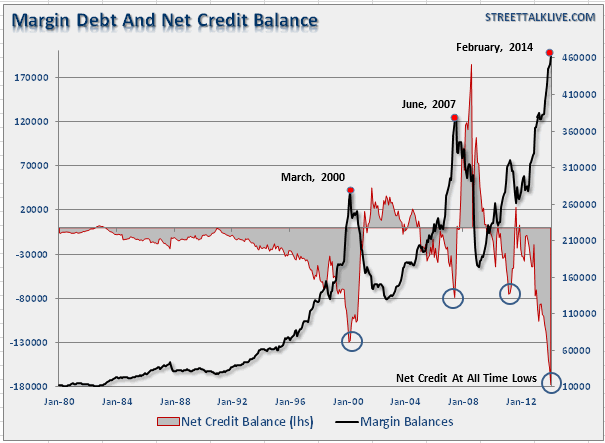
But I would certainly want to include another Lance Roberts graph. Because unlike the comparison charts, in which perceived similarities can always be contested, as long as they aim to predict events, it’s a whole lot harder to ignore. Margin debt is at a huge high, net credit at the polar opposite, and that should be reason to think.
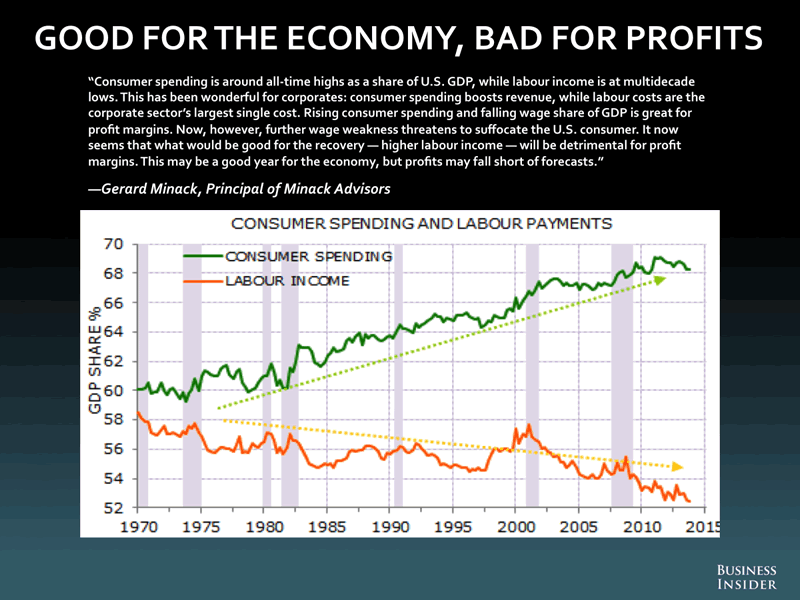
The next one from Gerard Minack, also published by BI, is interesting in that it shows the divergence through the past 40 years of consumer spending and labor income, which leads Minack to wax on what this means for corporates. But all I’m thinking is: if income as a percentage of GDP goes down, and spending as a percentage of GDP goes up, where does the money to increase spending come from? How is this not a picture of how much debt Americans have accumulated? And how inequality has risen at the same time …
Still, if you want to say anything about where stock markets may go, you can’t get around the fact that we have no functioning markets anymore. And this graph from Double Line depicts in fine detail why that is, and how it has come about.
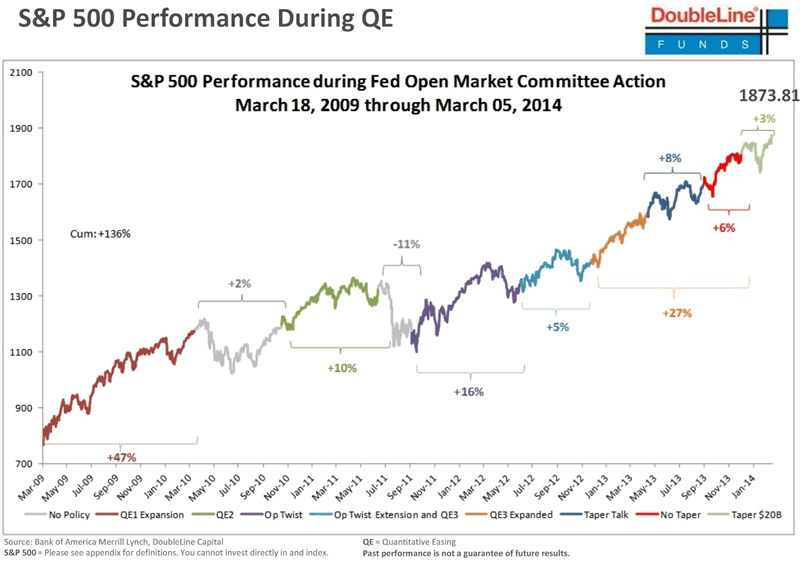
We need to realize that if you don’t have functioning markets, it’s very hard to predict anything at all about where they will go. I don’t think there’s anyone left who would seek to deny that the only thing that has kept up asset values, and even pushed them up, is central bank stimulus, i.e. money from everyone that is handed to the few. And even that would normally have to stop somewhere sometime, but since debt levels among the people in the street are already so high, stimulus doesn’t come from the people themselves, but from their children and grandchildren.
This may not be true if we attain some sort of mythical escape velocity growth in our economies, but that’s at the very least a huge gamble to take. If we don’t reach it, there’ll be almost literally hell to pay down the line. But perhaps it should be obvious by now that growth, or a better life, for everyone is not what the Fed or Capitol Hill, or their peers in other nations, are aiming for. They are engineering ways to guarantee more wealth for the already wealthy. That’s why banks are declared too big to fail. And why QE is handed to these banks, not the public. Is the Fed really that clueless if that is what they look to achieve? Or is everything moving according to their plan?
We know this whole thing will come down like a outback shack in a tornado, but in a market that exists only because of government and central bank largesse, the timing is hard to call. The ECB looks to be ramping up to buy trillions of euros in sovereign bonds, Germany is giving off signals that it might go along with it. And that could keep the fake markets train going for a while longer. There’s a window, though: Draghi can’t do it before the May 25 European elections. So we have another 6 weeks or so to do some truth finding. Then again, I wouldn’t be surprised if the boys and girls who run this Kabuki mirage pull the plug on the while thing any day now. At this point, every greater fool must be reinvested, and there have to be doubts about how much more they can be milked for. The lords of the dance can’t afford to get out too late, so, greedy as they are, they won’t wait for the last moment. All they have to do now is to make sure mom and pop will be left holding the empty bag.
By Raul Ilargi Meijer
Website: http://theautomaticearth.com (provides unique analysis of economics, finance, politics and social dynamics in the context of Complexity Theory)
Raul Ilargi Meijer Archive |
© 2005-2022 http://www.MarketOracle.co.uk - The Market Oracle is a FREE Daily Financial Markets Analysis & Forecasting online publication.


