Natural Gas ETF Points to Down Trend
Commodities / Natural Gas Apr 29, 2008 - 12:47 PM GMTBy: Mike_Paulenoff
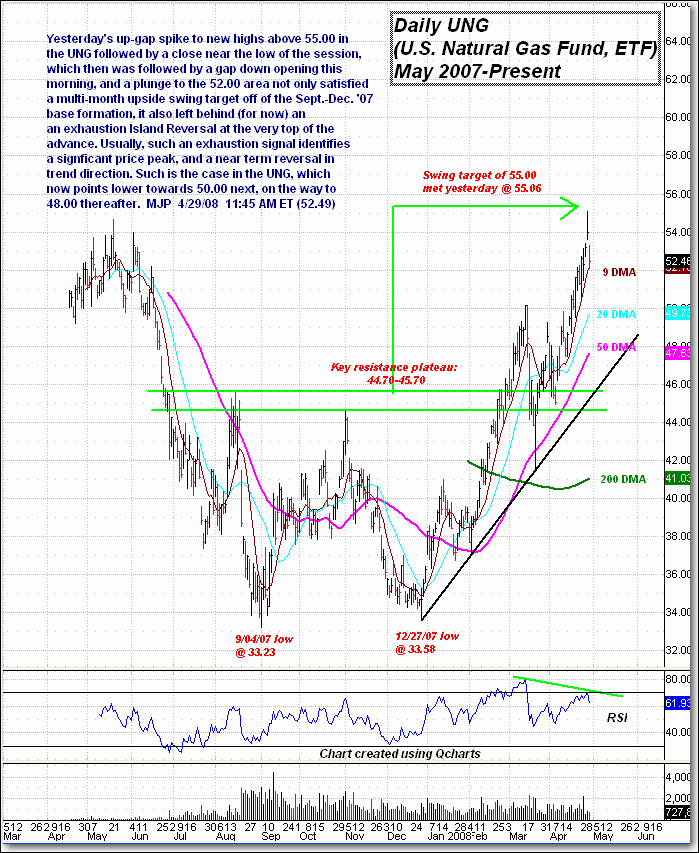
 Yesterday's up-gap spike to new highs above 55.00 in the U.S. Natural Gas Fund ETF (AMEX: UNG) followed by a close near the low of the session, which then was followed by a gap down opening this morning and a plunge to the 52.00 area, not only satisfied a multi-month upside swing target off of the Sept-Dec '07 base formation but it also left behind (for now) an exhaustion Island Reversal at the very top of the advance. Usually, such an exhaustion signal identifies a significant price peak and a near-term reversal in trend direction. Such is the case in the UNG, which now points lower towards 50.00 next, on the way to 48.00 thereafter.

Sign up for a free 15-day trial to Mike's ETF Trading Diary today.
By Mike Paulenoff
Mike Paulenoff is author of the MPTrader.com (www.mptrader.com) , a real-time diary of Mike Paulenoff's trading ideas and technical chart analysis of Exchange Traded Funds (ETFs) that track equity indices, metals, energy commodities, currencies, Treasuries, and other markets. It is for traders with a 3-30 day time horizon, who use the service for guidance on both specific trades as well as general market direction
© 2002-2007 MPTrader.com, an AdviceTrade publication. All rights reserved. Any publication, distribution, retransmission or reproduction of information or data contained on this Web site without written consent from MPTrader is prohibited. See our disclaimer.
Mike Paulenoff Archive |
© 2005-2022 http://www.MarketOracle.co.uk - The Market Oracle is a FREE Daily Financial Markets Analysis & Forecasting online publication.


