


Silver Up, Stocks S&P Down
Stock-Markets / Gold and Silver 2014 Apr 22, 2014 - 03:13 PM GMTBy: DeviantInvestor

 Silver has had three bad years while the S&P has had five good years. It is time for both markets to reverse.
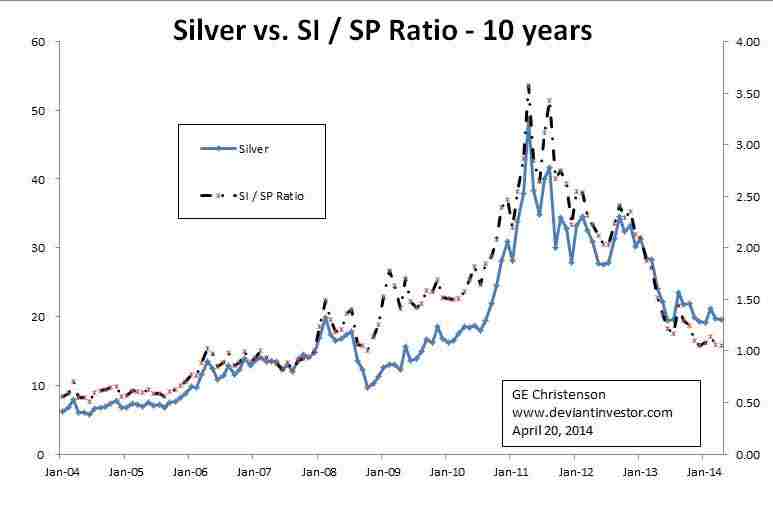
Examine the following graph of Silver versus the Silver to S&P ratio. It tells me the ratio has returned to levels seen in 2008 and that the ratio follows the price of silver. This is interesting but not that helpful.
Now examine the second graph in which the same ratio is plotted against the 14 month Relative Strength Index of the ratio. The RSI is a timing indicator that ranges between 0 – 100 and indicates buy zones when the indicator is low and sell zones when the RSI is high. Currently the RSI of the index is about 23 – quite low and indicating that the silver to S&P ratio should increase from here. Either the silver price should go up or the S&P should come down, or more likely, both will occur.
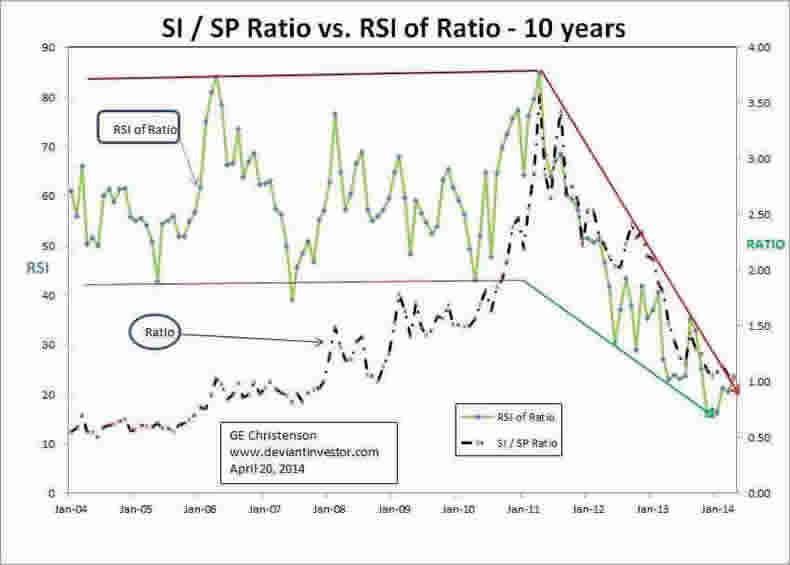
Note the RSI of the ratio was about 16 at the end of December 2013 when silver hit its double-bottom lows. That RSI reading was the lowest in 25 years. The December low in silver should have been an important bottom in the silver market and an important bottom in the silver to S&P ratio.
So What Does This Prove?
In a world of High-Frequency-Trading, managed and manipulated markets, gold leasing, politics, and Quantitative Easing, it might mean very little. In the short term, markets can be moved rather easily by large traders and influential forces such as central banks. But, in a longer perspective, the ratio of silver to the S&P is at a low, the actual S&P 500 Index is near an all-time high, and the RSI timing indicator for the ratio was at a 25 year low in December. The next major move is much more likely to be a rise in silver prices and a fall in the S&P. That major move might be many weeks away, but it seems both inevitable and imminent.
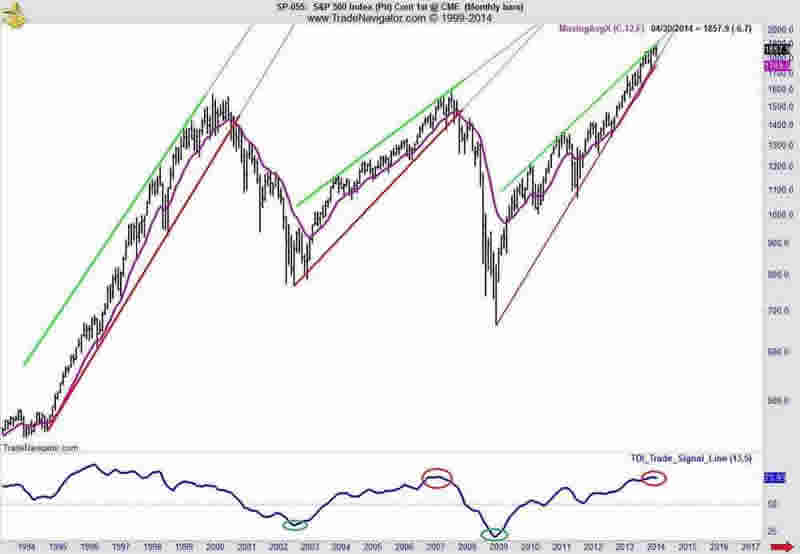
Consider this 20 year chart of the S&P. Does the S&P look safe and healthy?
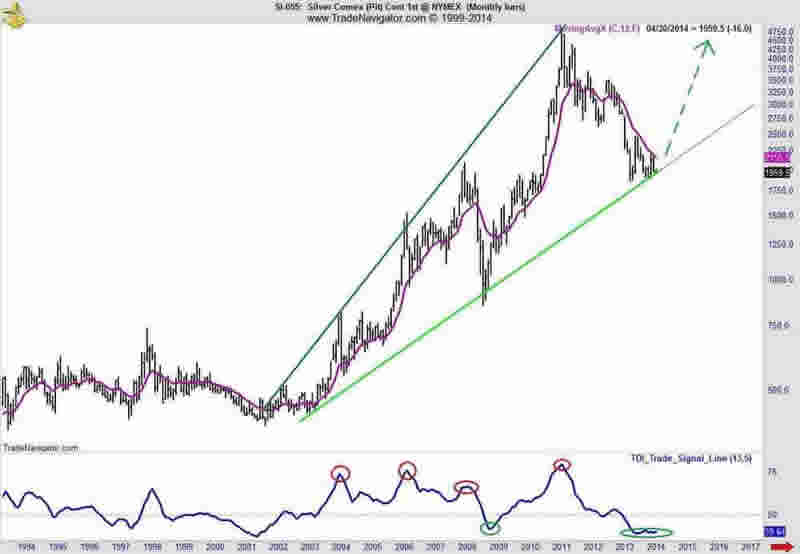
Consider this 20 year chart of silver. Does silver look like it has bounced off an intermediate bottom in a long-term bull market?
Conclusions
- The S&P is near an all-time high and looks toppy.
- Silver is near a 4 year low and looks like it has bottomed.
- The silver to S&P ratio is at a 5 year low and looks like it has bottomed.
- The RSI of the ratio hit a 25 year low in December.
- There appears to be far more downside risk in the S&P than in silver.
- In the short term, markets can be nudged up or down, but in the long term, the December 2013 low in silver looks like a turning point.
- We will know in a few months if the December low was an intermediate bottom or a prelude to another low. My bet is that the December low holds and silver prices will be far higher in 3 years.
An intriguing article from Bill Holter that addresses silver, an interesting interpretation, and a possible answer to questions about silver supply is My Back And Forth Yesterday with John Embry. I encourage you to read it.
GE Christenson aka Deviant Investor If you would like to be updated on new blog posts, please subscribe to my RSS Feed or e-mail
© 2014 Copyright Deviant Investor - All Rights Reserved Disclaimer: The above is a matter of opinion provided for general information purposes only and is not intended as investment advice. Information and analysis above are derived from sources and utilising methods believed to be reliable, but we cannot accept responsibility for any losses you may incur as a result of this analysis. Individuals should consult with their personal financial advisors.
© 2005-2022 http://www.MarketOracle.co.uk - The Market Oracle is a FREE Daily Financial Markets Analysis & Forecasting online publication.