


Stock Market Short-term vs Long-term
Stock-Markets / Stock Markets 2014 Apr 28, 2014 - 09:57 AM GMTBy: Andre_Gratian

 Current Position of the Market
SPX: Very Long-term trend - The very-long-term cycles are in their down phases, and if they make their lows when expected (after this bull market is over), there will be another steep decline into late 2014. However, the Fed policy of keeping interest rates low has severely curtailed the full downward pressure potential of the 40-yr and 120-yr cycles.
Intermediate trend - Probably tracing out an ending diagonal pattern.
Analysis of the short-term trend is done on a daily basis with the help of hourly charts. It is an important adjunct to the analysis of daily and weekly charts which discusses the course of longer market trends.
SHORT-TERM VS. LONG-TERM
Market Overview
It takes a while to discern the long-term patterns of the stock market. Only when they near completion do they become identifiable. Take the DJIA and SPX for instance. Since the beginning of the year, they have been engaged in a series of short-term gyrations which have not followed through, but have caused the bulls and the bears to re-state their firm convictions about the market. This is about to come to an end! A pattern is becoming clear and it favors the bears.
The long-term pattern, which is more easily identified in the DJIA, appears to be an ending diagonal pattern, normally associated with a market top. That the market is making a top in this time frame is perfectly consistent with the long-term Kress cycles that may (finally!) be rolling over for a low in the Fall. In the past, the 40-year cycle has been very regular, making its low in 1934, in 1974, and now scheduled to do so again in 2014. Since, by definition, a long-term cycle decline should start after a long-term top has been created by the market and since the 40-year cycle is just now -- after thirty-nine and a half years -- beginning to roll over for its final plunge, it is about time that this phenomenon should appear. Let's go directly to the Chart Analysis section and discuss this topping pattern in detail.
Chart Analysis
An ending diagonal consists of 5 waves: three up and two down. Each wave becomes shorter and shorter, but with the last one normally being longer that the next to the last. Since it is easier to recognize in the DJIA, let's start by analyzing this index.
Below is a chart of the daily DJIA (courtesy of QChart.com). I have outlined in red the pattern in question, although the first wave actually starts with the previous uptrend. Besides the above description, each wave of the diagonal is made up of three smaller waves. I have labeled the main waves a-b-c-d, with e on the way, and the smaller waves have been identified as well. We appear to be in the small b wave of the final e wave. We'll discuss the short-term later, but for now, be aware that the last wave is often an overthrow, as shown on the chart.
According to Bulkowski and many others, after the pattern is complete the minimum retracement is to the beginning of the pattern -- in this case, 14719.
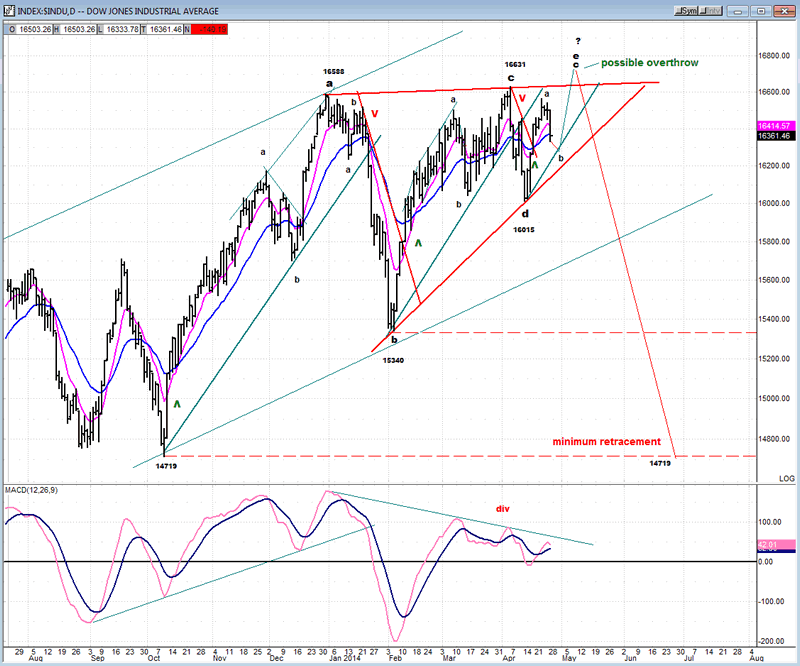
In earlier letters, I have mentioned that the cyclical configuration called for a potential top in early May. Since we now have guidelines for the completion in term of price and time, all we have to do is to sit back and wait to see if the analysis is correct.
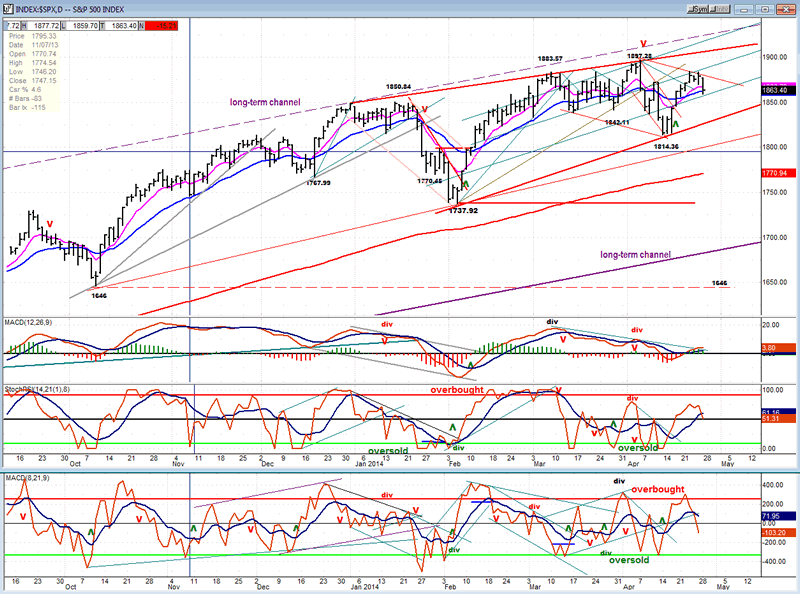
Let's now turn to the daily SPX chart (also courtesy of QCharts.com) and analyze it on a pure technical basis. First, just a brief mention that the diagonal pattern is also apparent here, but not as well defined as in the DJIA. The SPX is rising in a wedge pattern which is characterized by deceleration apparent especially in the MACD which is remaining barely positive (but in a generally declining trend since the beginning of March) and is in the process of rolling over again. The Friday decline has done technical damage to the other two oscillators as well: especially the A/D which started its decline on Thursday and has now gone negative, while the SRSI is neutral but has crossed below its slower MA. All in all, this is not a very bullish picture, but not decisively bearish, either. As long as the price remains above its MAs and especially above the heavy red trend line, the index has not started a confirmed downtrend.
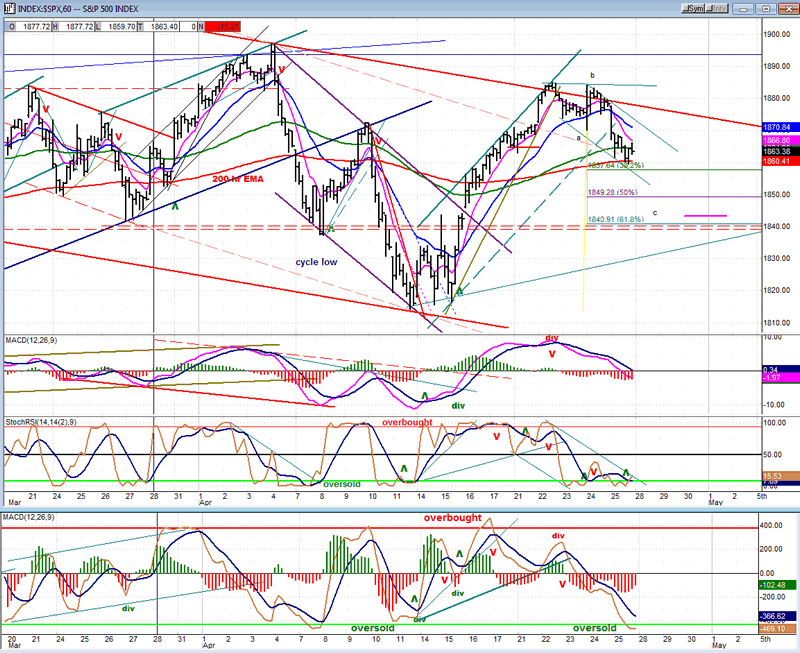
For a closer look at the current short-term correction which I warned about in the last newsletter, let's take a look at the hourly SPX chart (courtesy of QCharts.com).
When the former decline bottomed at 1814 and started to move up, it became possible to establish several channels the steepest and narrowest of which signaled that a new short-term uptrend had started when it was penetrated to the upside. The widest one (heavy red lines) caused the rally to find resistance and come to an end after making a small double top. The latest short-term correction started from the second top and immediately broke out of a new uptrend channel to confirm the end of the rally. However, shortly after doing so, prices decelerated visibly and appeared to be forming a small base from which to turn upward again. So, is the decline really over?
It could be but probably not, for several reasons. First, note that the current pull-back has only retraced less than .38 of the entire rally. That does not seem quite enough for a market which is apparently making a topping pattern. There was a near-term phase projection to that level and the index also found support on its 200-hr MA which is fairly common and which would account for this pause in the downtrend. But, in spite of a deeply oversold SRSI and A/D oscillator, the entire complex of oscillators does not seem quite ready for a reversal which could take SPX to a new high. It would be more credible if some basing action (including positive divergence) was apparent in all three oscillators.
Most likely, the index is getting ready to extend its decline to the next P&F projection (taken across the entire rally top) and that would take it down to about 1840 which happens to be a former support level around which prices gyrated for some time. But first, a little bounce is not out of the question.
Obviously, if SPX takes off on the upside Monday morning with strong volume and A/Ds support, the above scenario will have to be discarded. As of now, however, it is favored.
Cycles
"A short-term cycle high was expected over the week-end, so it could have topped on Thursday. If not, on Monday." - Actually, the top came on Tuesday and was followed by a brief period of distribution before the decline started.
There is a potential short-term cycle low due on Monday which could wait until Tuesday to bottom. This would give SPX plenty of time to bounce for a few hours, and resume its decline to the lower projection.
More important cycles are expected to top in the first couple of weeks of May. This would allow DJIA to complete its diagonal pattern before starting a protracted decline.
Breadth
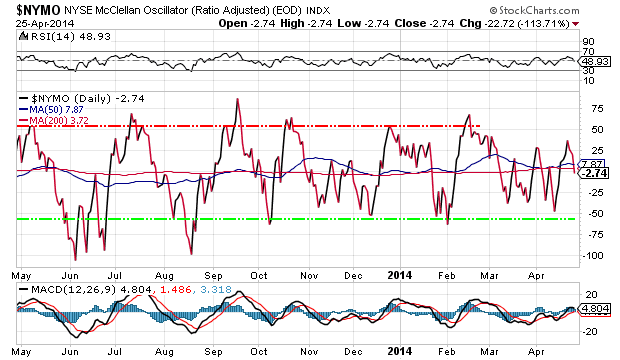
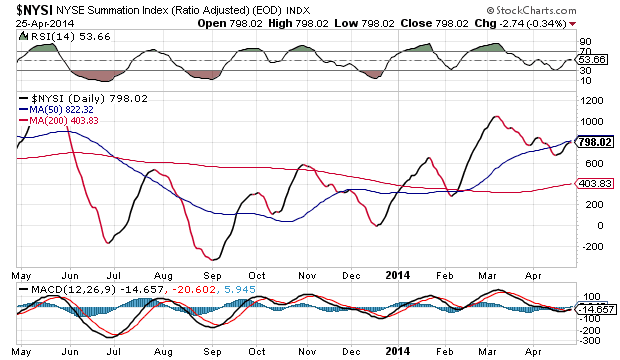
Below, we have the McClellan Oscillators and the Summation Index (courtesy of StockCharts.com).
The rally took the McClellan Oscillator to about the level of its former high before it turned down again. If we continue the correction, it should drop one more time toward the green line which represents an oversold level.
NYSI did not rally enough to get above its former top and re-establish its uptrend. Further correction in the NYMO would turn it down again, as well as its oscillator. Note that the MACD has remained negative throughout the entire rally.
Sentiment Indicators
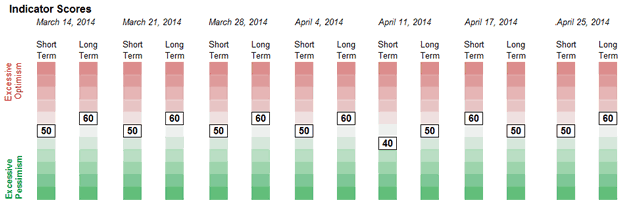
The SentimenTrader (courtesy of same) long-term and short-term indicators reversed positions this past Friday, with the long-term climbing a notch as a result of the rally. It is not yet significant, but the trend is in the right direction if we are looking for a top.
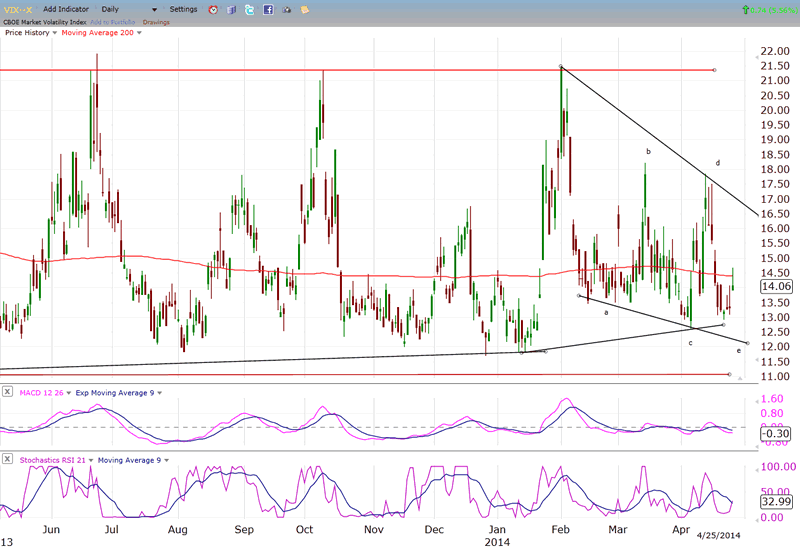
VIX (CBOE volatility Index)
If we accept that the DJIA, SPX and even the NYA are making topping patterns in the form of ending diagonals while other indices such as Russell 2000 and NDX appear to have already topped, it is easy to understand why VIX, which is more geared to the former, has not been anxious to break out on the upside. In fact, the pattern that it is making is inversely similar to that of the DJIA. It will start to move up in a substantial uptrend when the DJIA et al. have completed their formations.
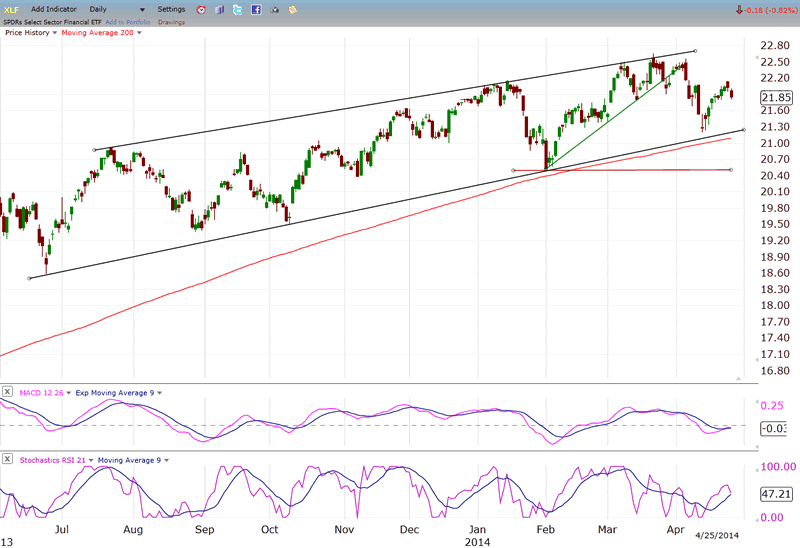
XLF (Financial ETF)
XLF continues to lag SPX, but it has made a somewhat similar pattern over the last few weeks. If SPX makes a new high, XLF may not do so, but the time frame of their tops should coincide.
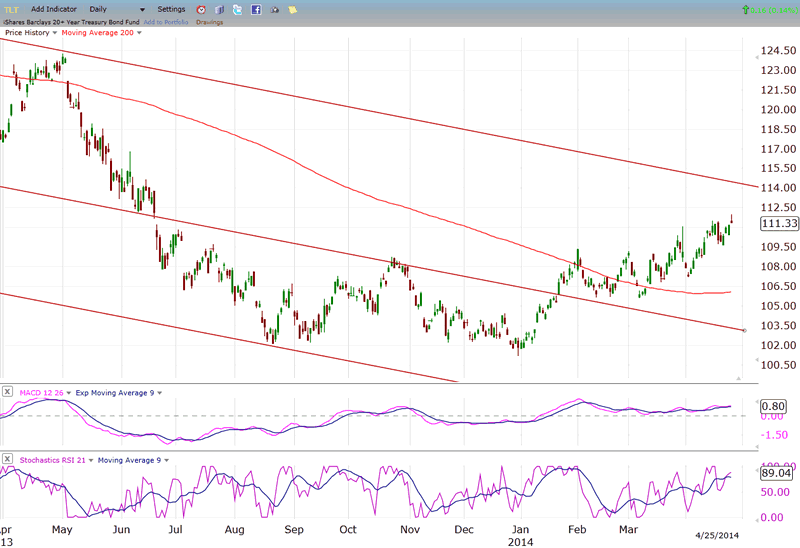
TLT (20+yr Treasury Bond Fund)
TLT is slowly grinding upward and could soon reach its top channel line where it should find resistance; but perhaps not for long if the market is making an important top.
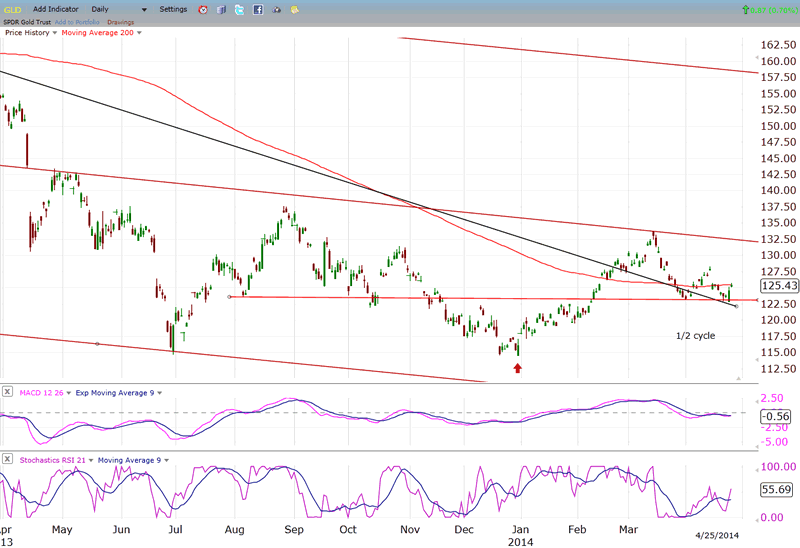
GLD (ETF for gold)
GLD has found support back-testing its downtrend line. It now needs to get back above the 200-DMA and again challenge the mid-channel line. The fact that it is past the mid-point of its cycle does not necessarily mean that it must now decline. There could be a larger cycle taking hold which will cause right translation in the 25-wk cycle and simply create a consolidation in a new uptrend when the smaller cycle makes its low. For now, as long as the dollar does not start a new uptrend of its own, GLD does not have to continue its short-term decline. The two oscillators look favorable to an attempt at resuming the uptrend, but we'll need to give it a little more time to prove itself capable of doing so.
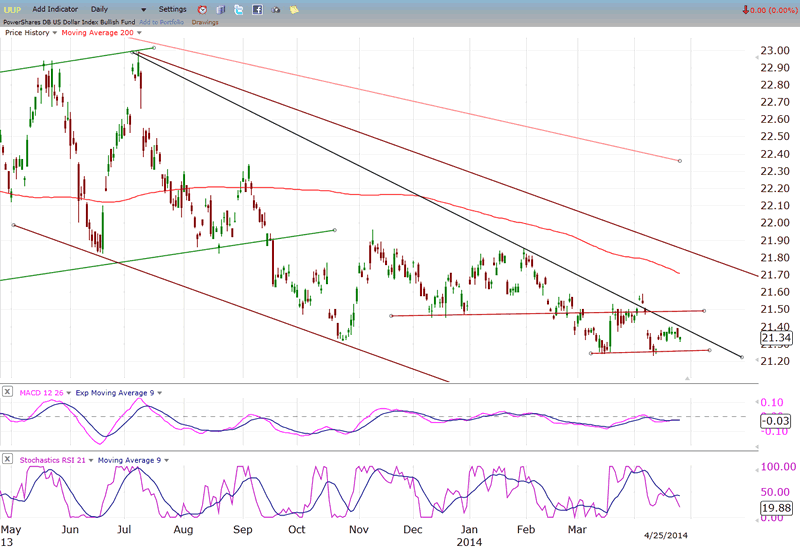
UUP (dollar ETF)
UUP continues to linger in what could become a basing formation. While it has not yet broken its downtrend line, neither has it been severely repelled by it. My guess is that it will eventually work its way through it but remain lethargic while it continues to trade in a narrow range.
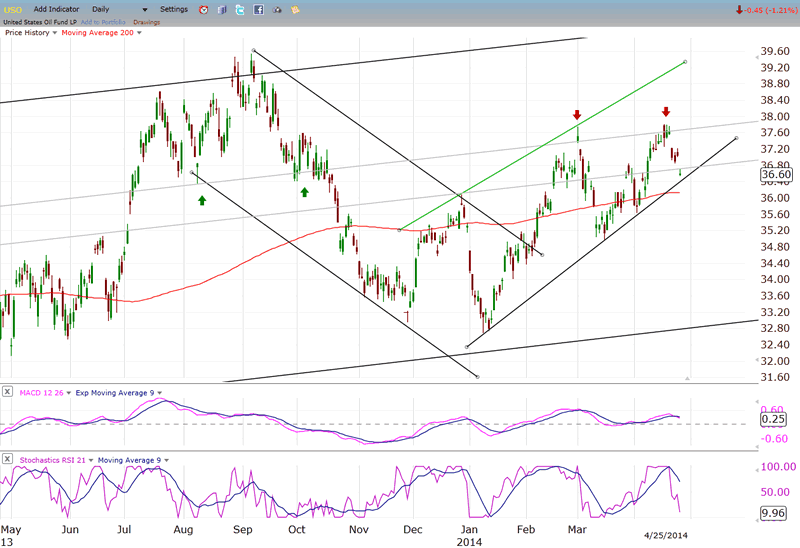
USO (US Oil Fund)
For the second time USO has found resistance at an internal trend line which has been providing both support and resistance over the past nine months. It is now about to challenge its uptrend line and, slightly below it, its 200-DMA. This is an index which has made little progress since the start of the bull market and which may eventually break below its long-term support line when a severe market correction begins.
Summary
I have presented a case for the formation of an important market top in the DJIA. At this time, it is a possibility which borders on probability, but which is by no means certain until it has been proven correct by the market itself. The good news is that we should know quickly whether or not this is a valid interpretation of the market's position. Early May is a time to be especially alert for the verification of the scenario presented above.
FREE TRIAL SUBSCRIPTON
If precision in market timing for all time framesis something that you find important, you should
Consider taking a trial subscription to my service. It is free, and you will have four weeks to evaluate its worth. It embodies many years of research with the eventual goal of understanding as perfectly as possible how the market functions. I believe that I have achieved this goal.
For a FREE 4-week trial, Send an email to: ajg@cybertrails.com
For further subscription options, payment plans, and for important general information, I encourage
you to visit my website at www.marketurningpoints.com. It contains summaries of my background, my
investment and trading strategies, and my unique method of intra-day communication with
subscribers. I have also started an archive of former newsletters so that you can not only evaluate past performance, but also be aware of the increasing accuracy of forecasts.
Disclaimer - The above comments about the financial markets are based purely on what I consider to be sound technical analysis principles uncompromised by fundamental considerations. They represent my own opinion and are not meant to be construed as trading or investment advice, but are offered as an analytical point of view which might be of interest to those who follow stock market cycles and technical analysis.
Andre Gratian Archive |
© 2005-2022 http://www.MarketOracle.co.uk - The Market Oracle is a FREE Daily Financial Markets Analysis & Forecasting online publication.