


Stock Market Support and Resistance Levels
Stock-Markets / Stock Markets 2014 May 12, 2014 - 02:11 PM GMTBy: Andre_Gratian

 Current Position of the Market
SPX: Very Long-term trend - The very-long-term cycles are in their down phases, and if they make their lows when expected (after this bull market is over), there will be another steep decline into late 2014. However, the Fed policy of keeping interest rates low has severely curtailed the full downward pressure potential of the 40-yr and 120-yr cycles.
Intermediate trend - Probably tracing out an ending diagonal pattern.
Analysis of the short-term trend is done on a daily basis with the help of hourly charts. It is an important adjunct to the analysis of daily and weekly charts which discusses the course of longer market trends.
SUPPORT AND RESISTANCE LEVELS
Market Overview
Last week was considered "critical" from a cyclical standpoint since several intermediate and long-term cycles were purportedly topping in this time frame. The market action turned out to be more of the sideways activity which has now characterized it for the past two months. Longer term cycles do not turn on a dime and the sideways action at the top could very well be a warning that the uptrend is slowly rolling over. The daily and weekly indicators suggest this very thing, but until we have confirmation in the form of a decline which is underway, we cannot rule out this being a price consolidation which will eventually result in a continuation of the uptrend.
A modicum of confirmation has already taken place in some key indices: the Russell 2000 (RUT), the NASDAQ 100 (NDX), the Banking Index (BKX) and the AMEX Securities/Broker dealers (XBD). All of these may already have started a downtrend of intermediate nature with RUT leading the charge by making a new low on Friday and trying very hard to remain above its 200-DMA.
In the more bullish camp, the S&P 500 (SPX,) NYSE Composite (NYA) and the Dow Jones Industrials (DJIA) have, so far, successfully resisted being pulled down by the leading indicators; the DJIA, seemingly the cheer leader of that group, even making a fractional new closing high on Friday. Hanging in the balance is the Financial Index (XLF) which does not appear to be able to make up its mind which group to join. This may be the one to watch! The decision that it makes may have repercussions for the trend of the entire market over the short and intermediate trends. If BKX suffers further deterioration, it will force the XLF to join the bearish group.
While last week was critical and turned out to be non-committal, next week may turn out to be more decisive -- especially Monday when a minor cycle is scheduled to make it low. On the other hand, the fact that it is an options expiration week could be a deterrent to protracted weakness!
In the next section, I am going to engage on some unorthodox analysis which I believe to be valuable. Please bear with me and try to see the logic behind it,
Chart Analysis
We'll start by looking at a daily chart of the SPX (Courtesy of QCharts.com) which is constructed as a line chart of the closing prices. This gives us a clearer picture of the market condition because, by drawing a few trend lines, we reveal some well-defined support and resistance levels that are crucial in evaluating the changes in market direction.
If we connect the three most recent tops with a line that extends back to the 2/11 peak, we find that all four points are in almost exact alignment. If we now draw a parallel to that line from the 11/25/2011 low (or the 10/04/2011 low), we have created a broad channel that defines the trend of the second phase of the bull market. As we can see, it is still up; at least it was until the SPX made its 1897 high. (The numbers shown in the last third of the chart correspond to intraday highs and lows).
By drawing lines that are parallel to the top channel line, starting from each of the previous short-term highs, we create trend lines that define both support and resistance levels. The first parallel to the long-term top trend line is drawn from the 11/13 peak. Since it has stopped the last two attempts of the SPX to move higher, I colored it red for resistance. The parallel just below it (drawn from the 10/13 peak), has offered support (in this case seen a little more clearly with intraday prices) all the way back to early November 2013. While it was penetrated twice, both times the index rallied above it. The next time it is breached decisively and becomes resistance, this will probably suggest that a trend change has taken place. The last two closes (1867 and 1854) are the ones to watch. If the index closes decisively below them on a daily basis, we may not find support until we reach the parallel drawn from the 5/13 peak (which has already offered support to the 1814 low).
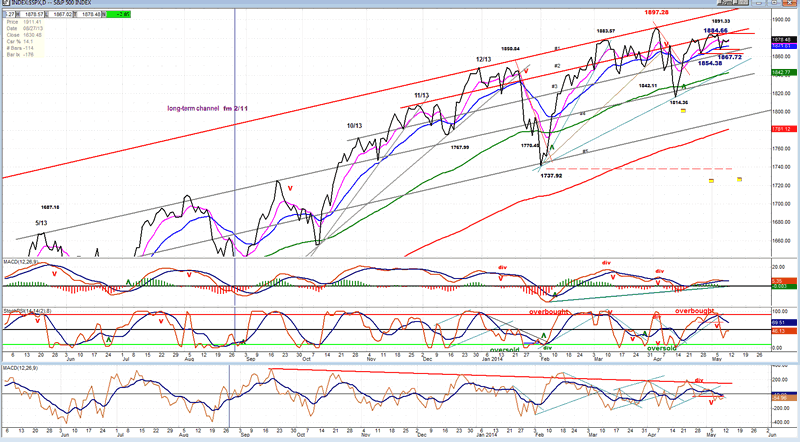
This process can be continued until we reach the bottom of the larger channel but, because we are attempting to identify a trend reversal, we are more immediately concerned with the second parallel. If it is broken decisively, it could give us an important sell signal.
Let's now take a look at the oscillators. At first glance, you can see that they show that the index is decelerating. The top and the bottom oscillators show that visibly. The top one (MACD), indicates a loss of price momentum, while the bottom one shows that the breadth of the market is deteriorating. These warnings -- which started 6 months ago and are consistent with the topping of long-term cycles -- were not visible at first. But now, they are unmistakable, and with the index failing to make a new high with the rally which started at 1814, we have come to a decision point! Next week either turns out to be a confirmation that we have started an important correction, or we have another challenge in store for the previous high. We may know the market's decision as early as Monday!
Next, we turn to the hourly chart (also courtesy of QCharts.com) for a closer look. Using the same trend line methodology that we used in the daily chart, we arrive at essentially the same results. The purple line at the top is the long-term line from 2/11. On the hourly chart, we can see that the (red) line which connects the last three tops is already pulling away from it. This is the first sign of deceleration! Using that line as our guide, we draw our first important parallel to connect a number of hourly closes starting with the high of 2/21, and the second one from the low of 2/19. This gives us the immediate support and resistance lines, between which trading is currently taking place. Breaking one or the other should determine the short-term trend of the index.
Now let's look at the dark blue parallels. The first two from the left define the trend from 1738. When the lower channel line was broken, a correction resulted. If we draw a parallel from 1814 (the low of that correction) it creates a trend line which has already been tested twice successfully on Friday; but the second push away from the line was much weaker than the first. The second hourly close on that trend line (1869) also found support on the second red parallel. I submit that the 1869 level -- the junction of the two parallels -- is a very important support level, and that if SPX closes below it, it could keep falling for a while.
We have a third set of (pink) parallels, with the key one drawn across the two highest closes of the 1897 and 1891 tops. If SPX closes below 1869 on Monday morning, it is very possible that it has started a correction that will be identified by the pink channel. If that's the case, it should close below 1869, 1867, and 1851 on an hourly basis.
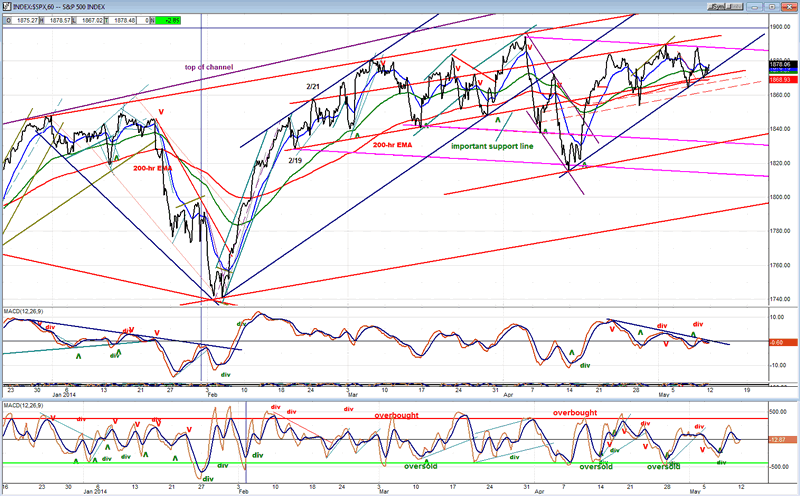
The MACD is in a declining trend which is tantamount to deceleration and negative divergence. The A/D oscillator is neutral, at best. Monday is shaping up to be a very important day!
Cycles
I am going to keep last week's commentary the same. It is still applicable:
"Erik Hadik is one of the most comprehensive cycle analysts I know. He had warned that an initial top could take place during the March 3-7 period and this proved to be correct since this is when the NASDAQ and Russell 2000 made their highs. He is also warning that a secondary period of highs could come between May 5 and 9, which is next week. Since the charts that I have posted above tend to confirm this prediction, it is another good reason to be on the alert next week."
Monday should mark the low of a minor cycle. It may exert enough pressure to break below 1869.
Breadth
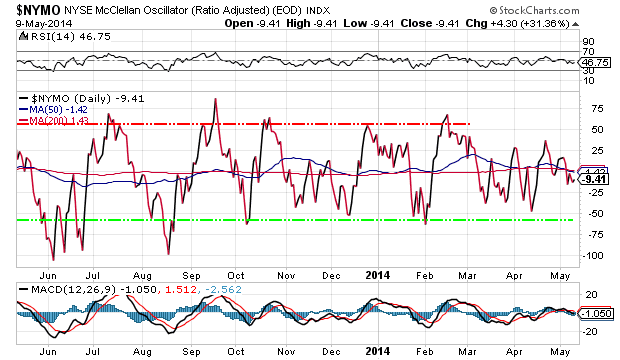
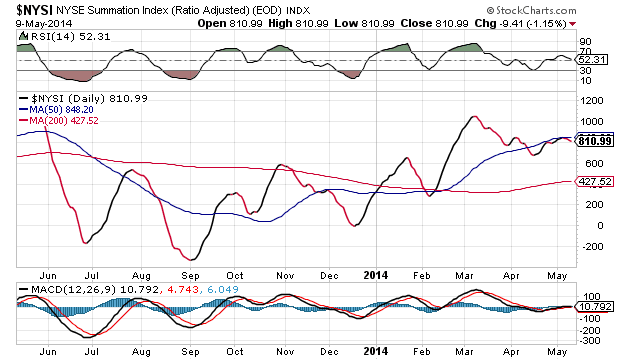
The McClellan Oscillator and the Summation Index appear below (courtesy of StockCharts.com).
The McClellan Oscillator is in a shallow decline mode and, for the moment, essentially neutral. Next week should decide if it drops to an oversold level, bringing prices down with it, or if it is getting ready for an extension of its rally.
The NYSI is slowly rolling over. Whether or not it accelerates its downtrend will depend on the behavior of the NYMO.
Sentiment Indicators
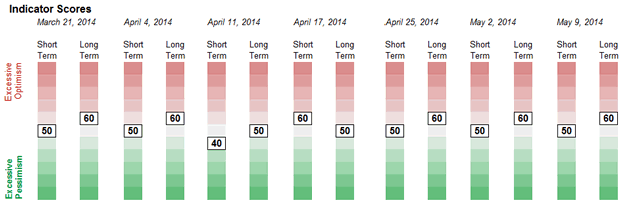
The SentimenTrader (courtesy of same) shows no change in its long-term and short-term indicators for last Friday. It does not have real forecasting value until it reaches more extreme readings.
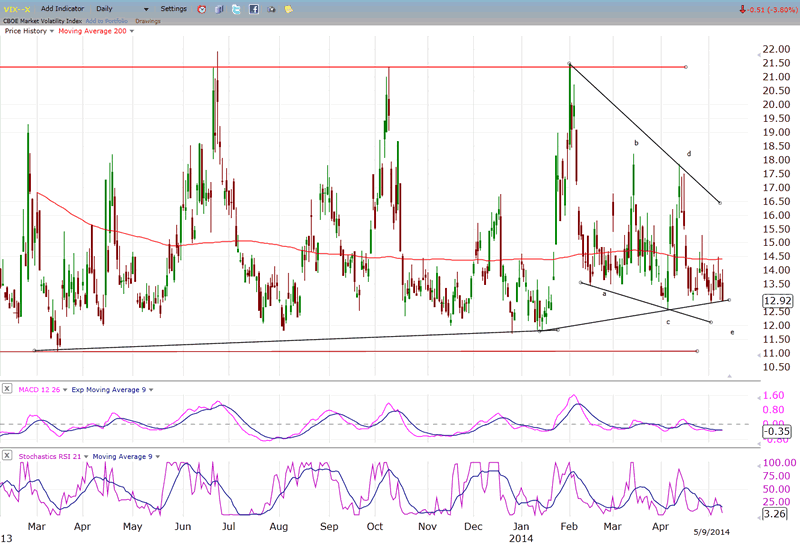
VIX (CBOE volatility Index)
VIX continues to show increasing long-term divergence to SPX and a down-pointing wedge pattern which should eventually resolve to the upside. Both of these are positive (negative for the market) but do not tell us anything about the timing of the reversal. However, it should be obvious when it takes place.
XLF (Financial ETF)
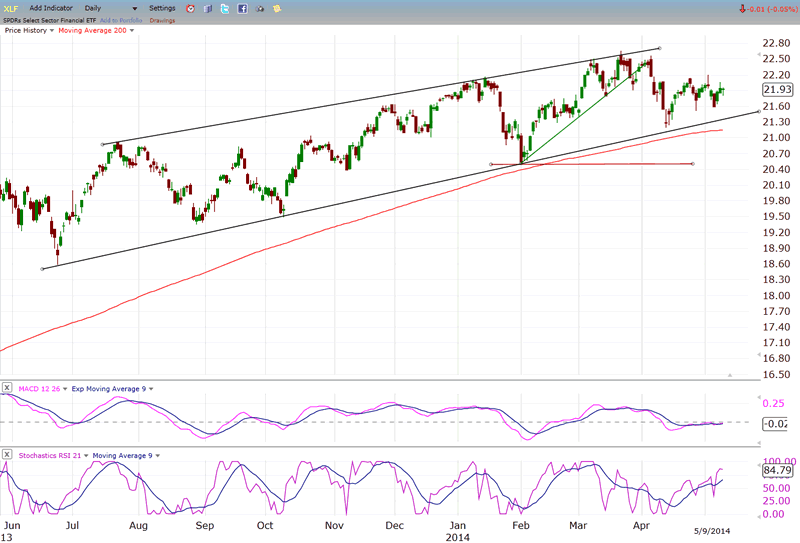
XLF continues to hold its middle ground by replicating the pattern made by SPX, but at a lower level. At the same time, it is not as weak as some of the other leading indices. XLF could be the key to what the market decides to do next. Should it decide to join the ranks of the weak, it will most likely pull the SPX down with it since it shares many of its components with the SPX. We should note, however, that the BKX (which also shares many of its components with XLF) is already weaker than XLF. Should BKX continue to weaken, we could witness a domino effect in the 3 indices.
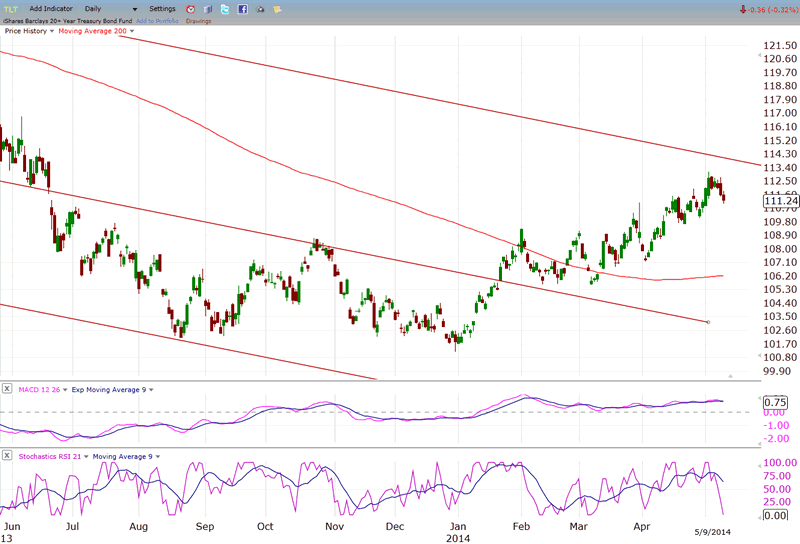
TLT (20+yr Treasury Bond Fund)
TLT is consolidating its advance. If this move turns into something more serious, it could have a positive effect on the equity indices. TNX is also consolidating above an important support level. Should it go through it, TLT will probably go through the top of its down channel at the same time.
GLD (ETF for gold)
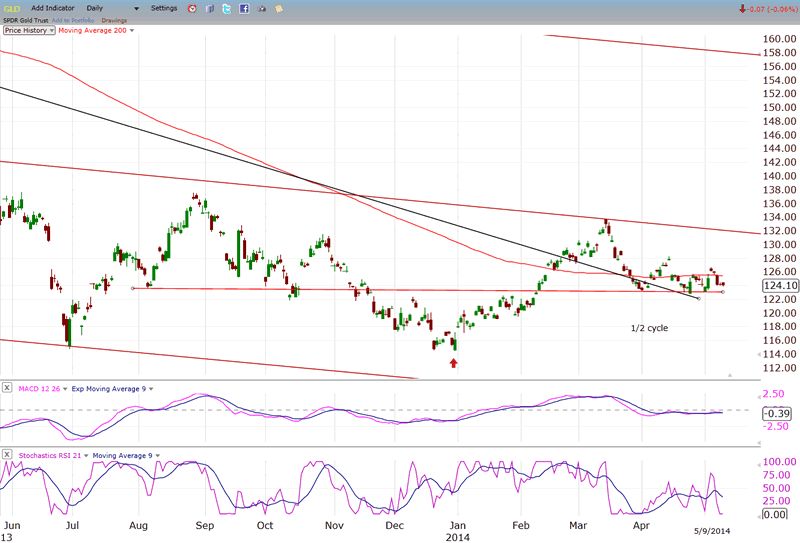
GLD continues to consolidate its recent advance. Because it is already well beyond its cycle mid- point, if it does start up, its move may be limited to the vicinity of the former short-term high (134), reserving a genuine resumption of its uptrend for the time when the next cycle starts up.
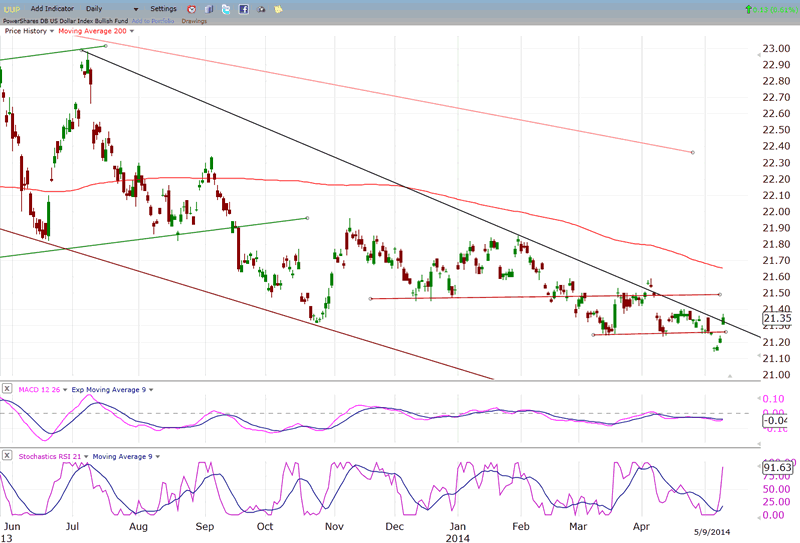
UUP (dollar ETF)
UUP may have ended its downtrend with a false break below its support line. Now that it has rallied above it and slightly above its downtrend line, it could be in a position to go outside the trend line entirely in preparation for a resumption of its uptrend.
USO (US Oil Fund)
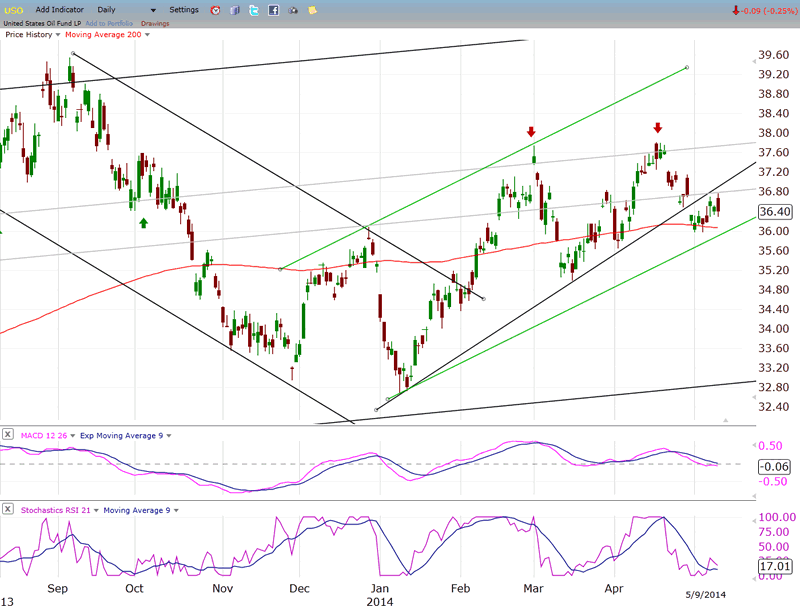
USO is not exactly a picture of strength but, after breaking its uptrend line, it did hold above its 200-DMA. However, it has already been repelled in its attempt to back-test the broken trend line by an internal resistance line. There is a good chance that it may re-test the MA next.
Summary
"Next week could be a decisive time period for the stock market. According to Erik Hadik, a cycle analyst who is widely followed and has a good track record, this is when indices will be coming into a cyclical period of intermediate and major cycle peaks. This analysis is consistent with the long-term Kress cycles which are scheduled to bottom around October, and which are long overdue in creating negative pressure on the market."
The fact that the averages did not break down last week is not proof that the cycle analysis was incorrect. The daily chart of the SPX (above) shows a rounding top pattern which is consistent with the topping of long-term cycles. It also shows the possibility that an incipient downtrend has started. Next week could be even more critical in telling us whether or not that downtrend will be extended into the beginning of a meaningful correction; or if the index will hold above those critical support levels and continue to grind upward.
FREE TRIAL SUBSCRIPTON
If precision in market timing for all time framesis something that you find important, you should
Consider taking a trial subscription to my service. It is free, and you will have four weeks to evaluate its worth. It embodies many years of research with the eventual goal of understanding as perfectly as possible how the market functions. I believe that I have achieved this goal.
For a FREE 4-week trial, Send an email to: ajg@cybertrails.com
For further subscription options, payment plans, and for important general information, I encourage
you to visit my website at www.marketurningpoints.com. It contains summaries of my background, my
investment and trading strategies, and my unique method of intra-day communication with
subscribers. I have also started an archive of former newsletters so that you can not only evaluate past performance, but also be aware of the increasing accuracy of forecasts.
Disclaimer - The above comments about the financial markets are based purely on what I consider to be sound technical analysis principles uncompromised by fundamental considerations. They represent my own opinion and are not meant to be construed as trading or investment advice, but are offered as an analytical point of view which might be of interest to those who follow stock market cycles and technical analysis.
Andre Gratian Archive |
© 2005-2022 http://www.MarketOracle.co.uk - The Market Oracle is a FREE Daily Financial Markets Analysis & Forecasting online publication.