SPX Stocks Index Stalls Beneath Its Peak
Stock-Markets / Stock Markets 2014 May 12, 2014 - 07:28 PM GMT What if SPX does not make a new high? This is my Wave Structure going into the weekend. The Dow made a new high today, but so far the SPX has not. This is indicative of (a defensive) rotation into the Blue Chips out of the momentum stocks.
What is interesting is that today is a highly charged Pivot Day. Should we see a turn down today or tomorrow without making a new high in SPX, we may see a setup for an explosive move to the downside.
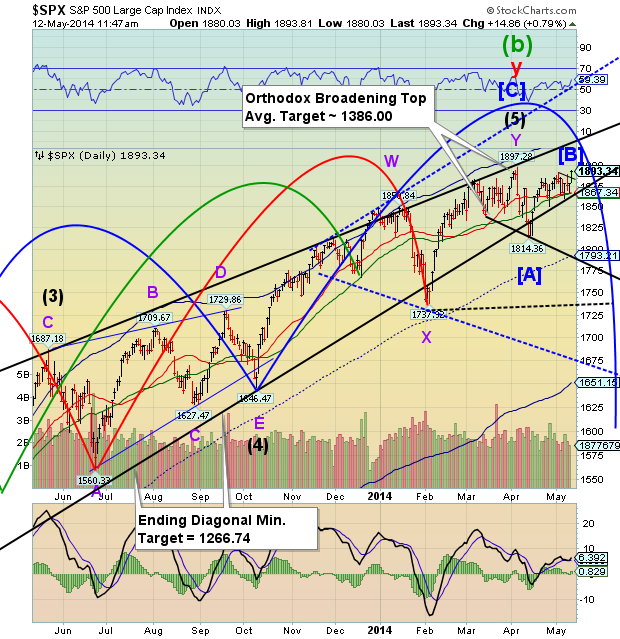
Remember my earlier commentary on the Orthodox Broadening Top. If point 5 (the current pivot being put in) does not meet or exceed the top of point 3 (April 4 high at 1897.28), then the formation becomes very bearish right from the start of the decline.
In the day following point 5, we may see Primary Wave [C] start with a gap down through the 50-day Moving Average and the Ending Diagonal trendline.
Why do I say that? Today’s new low in the VIX explains why the SPX hasn’t begun its decline yet. What it is suggesting is that VIX may be putting in an Intermediate Wave (2) while SPX is putting in an Primary Wave [B]. Intermediate Wave (3) in the VIX may correspond with a very Strong Intermediate Wave (1) of [C] in SPX.
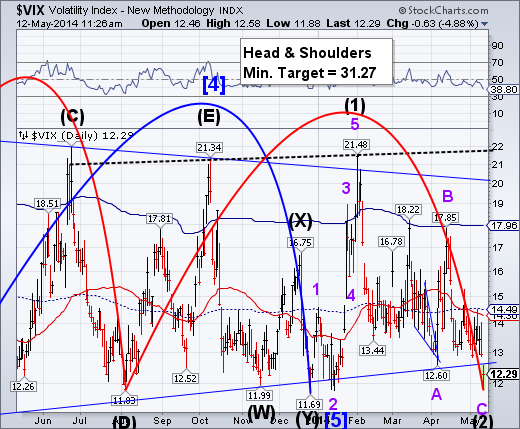
By the way, am contemplating re-labeling VIX to a Primary Wave [A] – [B[ instead of Intermediate Waves (1) – (2). A lot may depend on the behavior of the rally in VIX, which may be over by the time Intermediate Wave (3) is in the SPX.
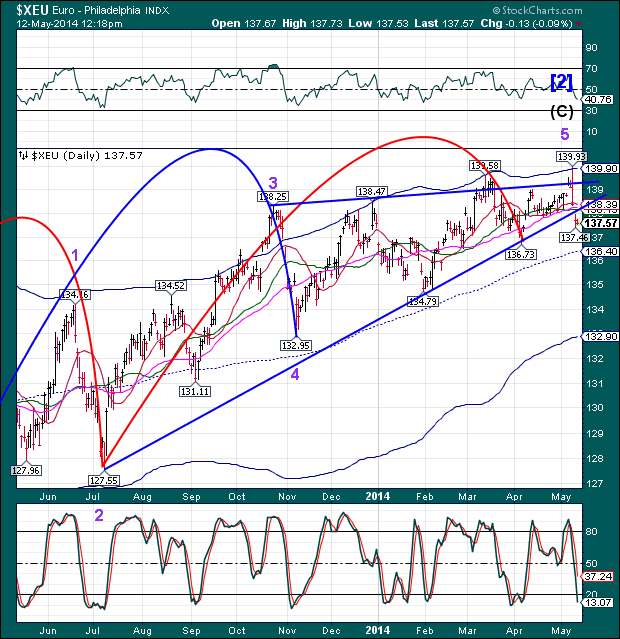
XEU has broken its Diagonal trendline last week and is consolidating today. It may attempt a retest of the Diagonal trendline and 50-day Moving Average at 138.19 before moving lower.
XJY is still in its sideways consolidation and I am waiting for the breakout. The lack of movement suggests that the Yen carry trade doesn’t have much to give to the rally in SPX.
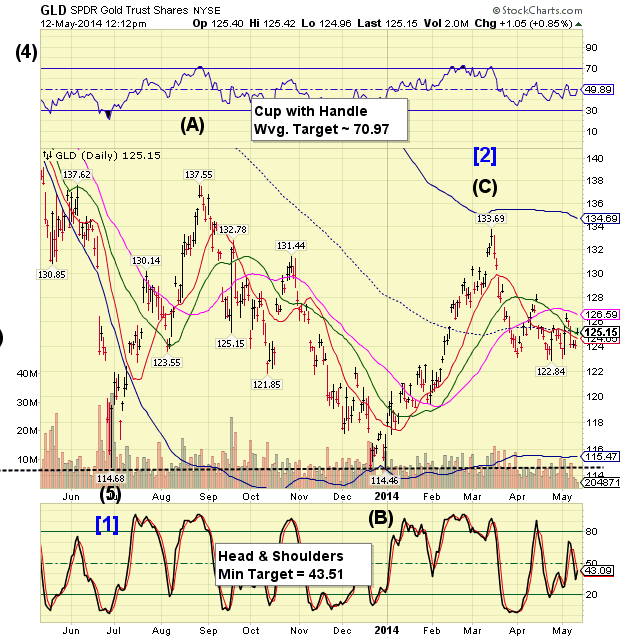
GLD has been challenging its Intermediate-term resistance at 125.09, which roughly corresponds with the 1300.00 level in Gold. It appears that there may be yet another challenge of that level before GLD resumes its decline.
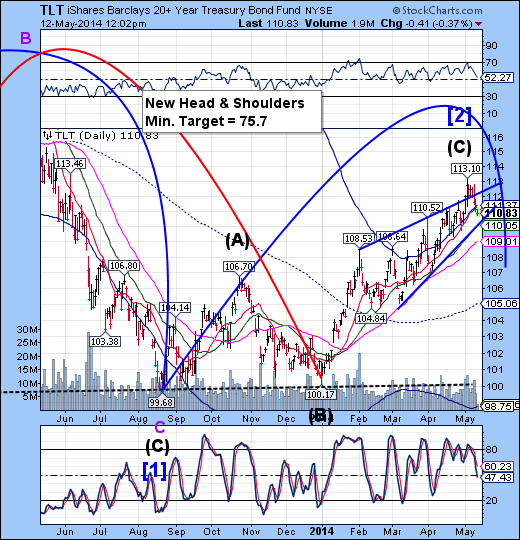
TLT is back inside its Ending Diagonal formation after a brief throw-over. It appears that the lower trendline of the Diagonal corresponds with Intermediate-term support at 110.05. When broken, it anticipates a decline back to the Head & shoulders neckline.
Regards,
Tony
Our Investment Advisor Registration is on the Web
We are in the process of updating our website at www.thepracticalinvestor.com to have more information on our services. Log on and click on Advisor Registration to get more details.
If you are a client or wish to become one, please make an appointment to discuss our investment strategies by calling Connie or Tony at (517) 699-1554, ext 10 or 11. Or e-mail us at tpi@thepracticalinvestor.com .
Anthony M. Cherniawski, President and CIO http://www.thepracticalinvestor.com
As a State Registered Investment Advisor, The Practical Investor (TPI) manages private client investment portfolios using a proprietary investment strategy created by Chief Investment Officer Tony Cherniawski. Throughout 2000-01, when many investors felt the pain of double digit market losses, TPI successfully navigated the choppy investment waters, creating a profit for our private investment clients. With a focus on preserving assets and capitalizing on opportunities, TPI clients benefited greatly from the TPI strategies, allowing them to stay on track with their life goals
Disclaimer: The content in this article is written for educational and informational purposes only. There is no offer or recommendation to buy or sell any security and no information contained here should be interpreted or construed as investment advice. Do you own due diligence as the information in this article is the opinion of Anthony M. Cherniawski and subject to change without notice.
Anthony M. Cherniawski Archive |
© 2005-2022 http://www.MarketOracle.co.uk - The Market Oracle is a FREE Daily Financial Markets Analysis & Forecasting online publication.


