Negative Interest Rates Fail to Change Trend in Silver - MAP Wave Analysis
Commodities / Gold and Silver 2014 Jun 09, 2014 - 10:57 AM GMTBy: Marc_Horn

 I have found some time to update silver and gold, and last weeks negative interest rate announcement by the ECB managed no more than to affect the centi fractal wave scale, not even putting a blip on the deci wave scale! The downtrend continues and I am beyond words about the stupidity of the decision. WE ARE IN A DEFLATIONAY SPIRAL GLOBALLY and even though critics will argue. This is confirmation of information that we have all known for a long time, however if there is one thing guaranteed - politiicans will only act once it is too late - CRISIS MANAGEMENT! I suspect France was pushing hard, as the French economy is now officially even LESS PRODUCTIVE than Greece!
Europe has been following the path of Austerity DEFLATION is a global trend, which like any other manipulation CANNOT be changed by our continued following of the Keynsian Economic Model - IT DOES NOT WORK! Adam Smith called it the invisible hand - the corruption that develops in the political systems we have tried to date all have ended the same - self serving public officials, be they elected or dictators - the end result is the same!
They warned us about confiscation of savings - Cyprus was the test! They warned us about Negative interest Rates - Done! They have warned us about raising taxes, with Liggard even saying as much as 80% - In progress - the NSA is not about terrorism - it is spying on everyone - they are tracking down where money is and even in the UK now they can raid your savings if they feel you owe the taxman something! They have warned about confiscating 20% of savings from all bank accounts - most likely what they think they can get away following the Cyprus experiment!
What is this doing - IT IS COLLAPSING THE GLOBAL ECONOMY! Why? Even with record low interest rates there is NO DEMAND FOR MONEY and people are starting to understand that those in power have no idea what they are doing and it is becoming more and more evident. This is about capital flows - capital seeking safety as confidence in government collapses! Traditionally it was easy enough for you to buy some gold and silver and just move it or bury it and come collect it later. They are tracking every movement of gold from source to sale and resale! People are waking up to this and the penalties are severe for trying to protect your wealth in this way - hence demand decreases and for those gold bugs I would strongly suggest you go do economics 101 - if there is no demand prices drop - as simple as that! So if you want to open your eyes and not loose the shirt off your back by listening to the endless nonsense spewed out about gold being real money and the gold/silver ratio etc read on and those who like waffle and gossip don't waste your time reading this.
"Insanity: doing the same thing over and over again and expecting different results." Albert Einstein
When will we learn? Until that day comes we will continue repeating history - start clean after revolution, slowly do away with what has been achieved by revolution, when rulers run out of money turn against the people until they can take no more and then the next revolution! Welcome to the 309 year fractal wave scale! We are coming to the end of the industrial revolution and it is time for change!
Detailed projections below are from my blog MAP Wave Analysis.
As an introduction to my recent updates if you have not read Silver and no one believes it is going to drop posted on 21 October 2012 it will help place context and reference for much that has been said below in my recent updates.
Silver Yearly - 2014
Silver, like gold, has nicely been following its projections, making new lows in the middle of 2013 as opposed to "early next year"!
So where is it going now? Further down!
Looking at the big picture, and I know we are almost half way through the year we can see that silver found support with last years (2013) low on Q123ML. This would have sufficed as a minimum correction, however I have put in Q234 (faint) and prices have broken below its MLL, which is not a good sign, indicating weakness and also the smaller scale wave formation confirms this weakness as discussed in the quarterly update.
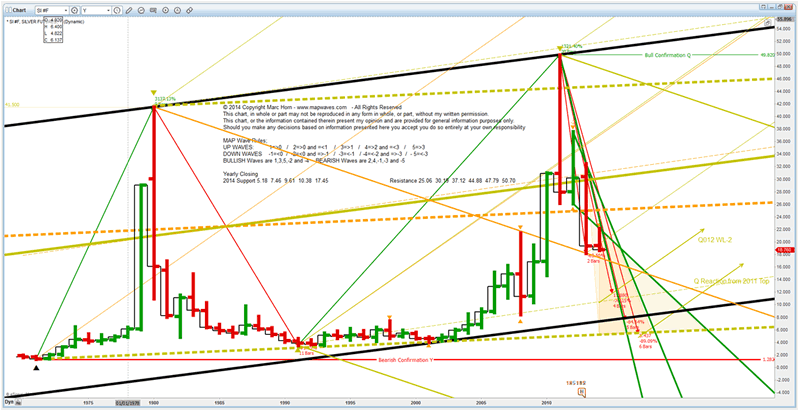
This correction (Q4) should not drop below the current yearly channel (bold black lines) so could go below $8.
I have added Support and resistance levels which are smaller scale where bounces are expected, however the yearly support stands at 5.25 and 7.80, and resistance at 30.12 and 50.70.
For those that are interested I have included the bull market and bear market as follows;
1971 low to 1980 high with a 3137% rise to 41.50 in 9 years.
To its 1991 low of 3.505 it retraced 91% of its value in 11 years.
Then to its 2011 high of 49.82, it gained 1321% in 20 years.
So far it has lost 63% in 2 years.
In gold we have had a 9 year bull market, followed by a 19 year bear market followed by a 12 year bull market and are currently in the 3rd year of the bear market so there clearly is no direct correlation of their cycles from this little data!
Silver Quarterly 2014
Below I have shown the current quarterly trend channels for silver. Starting with the big picture;
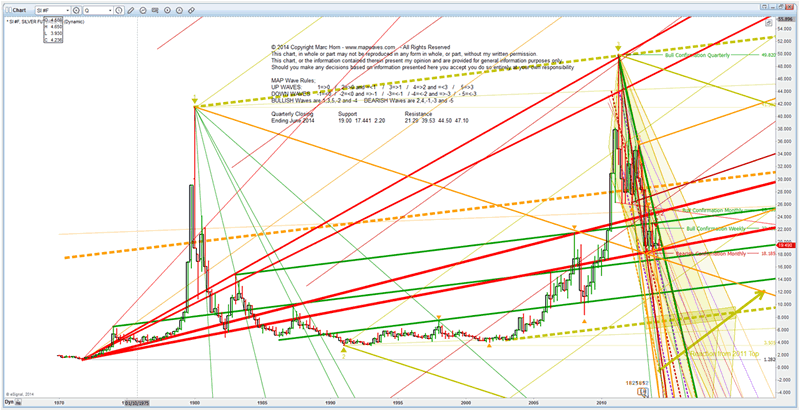
Note the orderly fashion in which markets move, where I have left important trend lines dating back to the 70's, and below you can still see that support or resistance is offered by these lines!
Below you can see the detail off the current channels. I have also shown the expected bottom sometime as early as Q3 2015 to as late as Q1 2020.
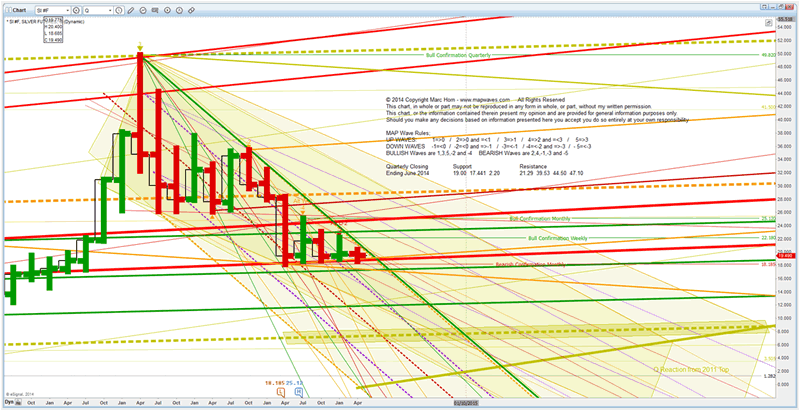
Ending June 2014 Quarterly Closing Support 19.00 17.441 2.20 21.29, Resistance 39.53 44.50 47.10
Silver - Monthly June 2014
Silver closed below its May support and opened weak, below what was May support and now it’s first June resistance! Failure to close above 19.24 is very bearish as that would be a 4th failure (support retest) of its M-1-2-3MLL so we could expect a rapid slide pausing around its primary June support of 17.40.
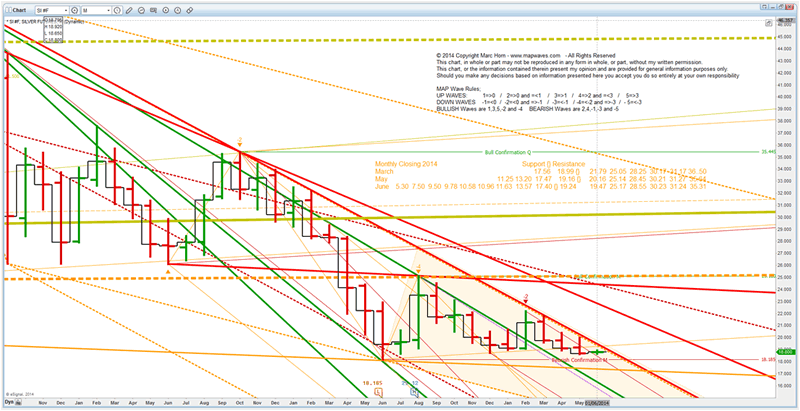
As you can see prices are along the MMF0-1-2MLU, indicating assuming the count is correct, a strongly overbought position so when it breaks expect big drops.
Monthly Support {} Resistance has been added to the chart.
Silver Weekly June 2014
WC 9th
Weekly Closing June 2014 Support {} Resistance
- WC 9th 15.37 16.66 17.40 18.51 {19.00}19.24 19.50 19.72 20.18 20.60 21.83
- WC 2nd 15.86 17.56 18.55{}19.01 19.49 20.20 20.75 21.86
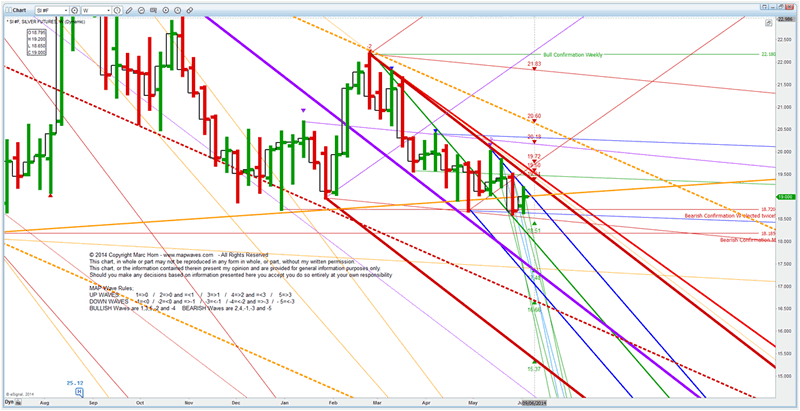
Silver closed on its first level of resistance of $19.00 (I manually read them so not worried about the 1 cent!) after breaking through to possible complete a smaller fractal wave scale (not checked as time constraint!). Both silver’s high and low were weak. Again for the third time the low elected the bearish weekly confirmation and the 4th time – down she goes! So this week if the smaller fractal formation is not complete expect a high to test 19.24, which is unlikely as last weeks low was on the ML, followed by a test of support at 18.51 and if that fails a rapid drop to elect it’s monthly bearish confirmation and test the 17.40 level. That ideally will occur no later than the end of June. This would then be the first possible end to this downtrend using MAP wave rules on their own. However MAP forks will determine wave completion.
WC 2nd - Last week, WC 28APR silver elected its weekly bearish confirmation, and again last week. Also last week prices opened above weekly support provided by the bullish weekly alternative fork and rapidly fell through monthly support and bouncing on the weekly support of WTF345MLL.
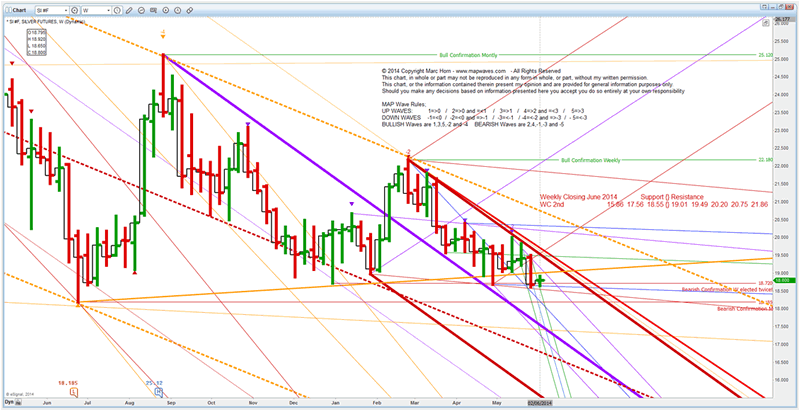
Prices are expected to retest the $19 before mid June at its first resistance level, before continuing down.
So what you have seen is that indeed there is order to the decline in silver, as there is in gold and it is predictable! So stop listening to the nonsense of the masses - remember the majority MUST be wrong before a change in trend can occur. Change your behaviour if you dont want to loose everything when the contagion starts in the sovereign debt crisis.
MAP Wave Analysis is based on the combination of my modifications of Elliott Waves, Babston's Action and Reaction, and, Andrews Pitchforks, all of which unfortunately are so misapplied. It would appear that they all took their secrets with them to their graves.
Their principles are so simplistic, and being a believer in the KISS principle (Keep It Simple Stupid) I quickly took to them.
To me it was clear though that it was not the result of Newtonian physics, but human behavior!
MAP Wave Analysis gives unemotional high probability projections, BUT ONLY IF YOU USE THE CORRECT PIVOTS!
A good starting point is to speak the same language, so start with the Terminology which you can refer back to whilst going through the Theory. For a quick summary see my first publication The Euro as an Example of my Techniques
By using this MAP Wave Analysis (MWA) you confirm that you are personally responsible for any and every decision you make based on any content found on this site.
- You confirm that you have read and agree to abide by the Copyright and Intellectual Property Rights as stated .
- You confirm that you have read and agree to follow Your Duty of Care as stated
- You confirm that you have read and agree to and take full personal responsibility for your decisions as stated in the Disclaimer.
- You confirm that you have read and agree to and will abide by principles of my Terms of Service as stated.
For other articles published click here
© 2014 Copyright Marc Horn- All Rights Reserved Disclaimer: The above is a matter of opinion provided for general information purposes only and is not intended as investment advice. Information and analysis above are derived from sources and utilising methods believed to be reliable, but we cannot accept responsibility for any losses you may incur as a result of this analysis. Individuals should consult with their personal financial advisors.
© 2005-2022 http://www.MarketOracle.co.uk - The Market Oracle is a FREE Daily Financial Markets Analysis & Forecasting online publication.


