Demystifying WD Gann’s Square-of- 9
InvestorEducation / Technical Analysis Jun 09, 2014 - 11:18 AM GMTBy: Submissions
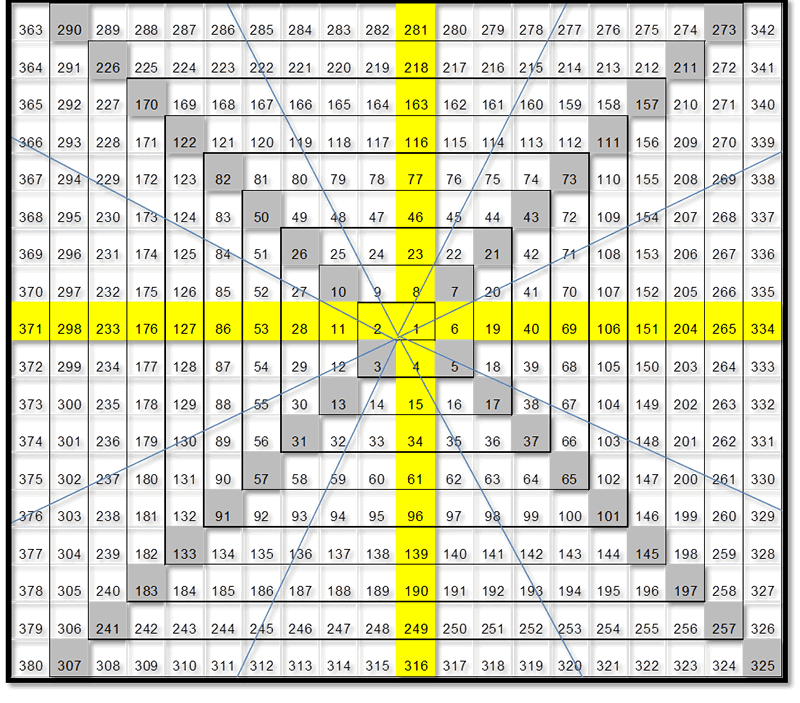
 Pauline Novak-Reich writes: 1. The Square-of-9 is a spiral of consecutive numbers unfolding counterclockwise, in the direction of the Milky Way, hurricanes, whirlpools and all other known spirals in nature. When pulled from the number 1 at the centre, the Square transforms into a voluminous pyramid. The Square-of- 9 served as blueprint for the construction of the Great Pyramid.

2. Graphs:
Given that the X axis of a graph represents time, and the Y axis represents price, and given that X and Y are interdependent, tracking the forward procession of time is less challenging than tracking price changes.
3. While Gann spoke of a “time factor”, he never factored price.
4. The Square-of-9 is an apparatus originally designed to track the up and down intervals of inundating rivers. Gann discovered that the ups and downs of markets are essentially the same.
5. The termination of any two adjacent time-intervals (one with price rising and the other with price falling) map onto the Square at 180° or 360° angles. No other angular configuration will trigger a market turnaround.
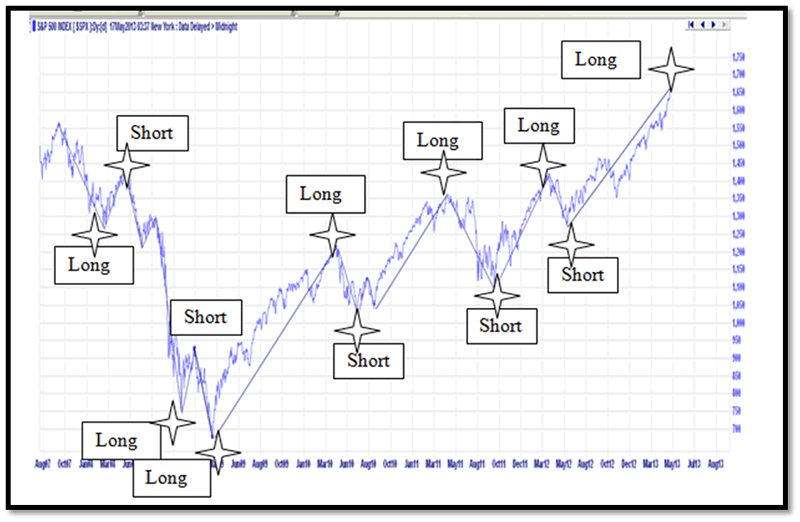
6. The dominant trend’s intervals must always be longer in duration than their corrective counterparts. The image below captures the S&P500 Index’s decline from 2007 to 2011 and the recovery that followed.
Emotive waves, being the longest, often result in two separate peaks for an uptrend, or lows for a downtrend. In an uptrend, the “price peak” always comes first and is then followed by a secondary “time peak”, which often terminates at a lower price level, but its duration is longer (check the S&P’s two Peaks of October 2007 on your daily chart and you will find that the interval leading to the October 31 peak was longer is duration than the decline that preceded.

7. Correctly identified swings map onto the Square-of-9 geometrically at 180° or 360° angles. Swings based on price ranges do not.
8. Intervals are subject to “time dilation”. When a swing falls short, or extends beyond the Square’s geometrical values, it must be “adjusted” to the nearest cardinal or diagonal value.
9. All swings are consistent with the Elliott Wave pattern. Wave I of a new cycle forms a 360° angle with the preceding Wave C ― the bear market’s final downswing.
10. Impulse Waves I, III, V & A form 180° angles with respective Waves II, IV and B. Impulse Waves V and A terminate at a 360° angle. Waves A and B terminate at 180° angle.
Chart Key:
NC = Northern Cardinal
SC = Southern Cardinal
WC = Western Cardinal
SE D = South-eastern Diagonal
NW D = North-Western Diagonal
NED = North eastern Diagonal
South western diagonal
Total cd = Total calendar days

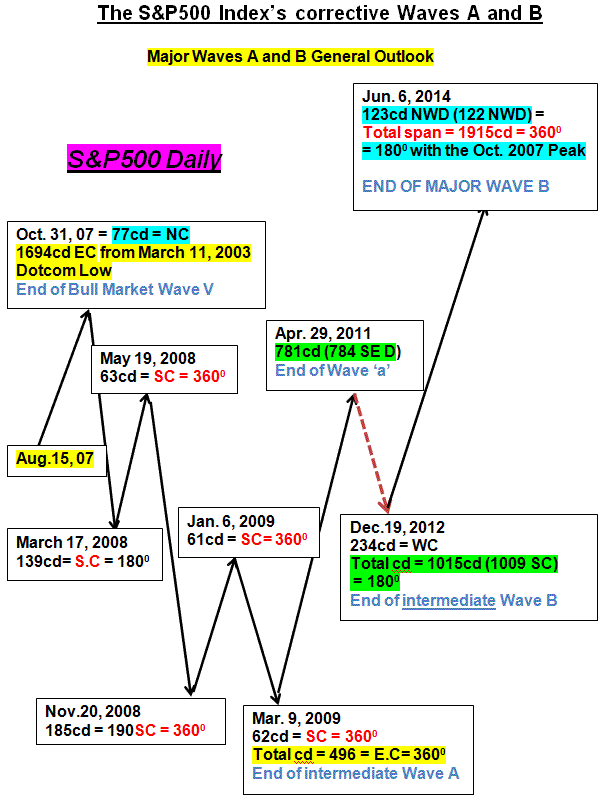
The schematic pictures the S&P’s intervals from October 31, 2007 to May 27, 2014. Major Wave A of the decline (Oct. 31.07 ― Mar. 9, 09) spanned 496cd and terminated upon the Square’s eastern cardinal.
Major Wave B (Mar.9, 2009 – May 27, 2014) is now 1015cd-long and is touching upon the Square’s southern cardinal’s 1915, where it is expected to terminate at an 1800 angle with the 2007 peak of 77cd (NC) and at 3600 with the Jun. 6 ― Mar. 9, 09 swing .
Major Wave B is irregular in that it exceeded the peak of wave V ― the point at which the bull market ended and the GFC (Global Financial Crisis) kicked in. Overall, it gained 161.8% of the 2007 – 2009 drop.
If Elliott was right, than the 2007 peak terminated a 150 year-long bull market of which Wave I began to unfold in 1857 and terminated in 1929 – marking the first twentieth century share market crash. Wave II ended in 1942, Wave III in 2000 and Wave V in 2007.
******
The key to the S&P’s 2009 – 2014 advance is in the lesser scale-order components (Apr.29, 11 ― Dec. 19, 11):
- April 29.2011 marks the termination point of intermediate wave ‘a’ (Mar.9 - Apr. 29. 2011 = 781 cd (784 SE D)
- Dec,19 marks the termination point of intermediate wave ‘b’ (194cd = SC)
- May 28 – June 5, 2014 is (more or less) the termination point of intermediate wave ‘c’ (886cd = SC = 3600) with the bottom of Dec. 19, 2011.
- The first minor a-b-c correction (Apr. 29 ― Jun 15 ― Jul 8 ― Oct.3) yielded 47cd (NC), 22cd (NC) and 117cd (NC) – three 360 degree northern cardinal alignments. Their span measured 186cd (190cd = SC).
- Intermediate wave ‘b’ (Oct.3, 11 ― Nov. 11, 11) measured 39cd (40= SC & 1800 given that waves ‘a-b’ aligned at 180 degrees on the Square).
- Intermediate wave ‘c’ (Nov. 11 ― Dec.19) spanned 38cd which yielded a 3600 termination of minor waves ‘b & c’ upon the Square’s SE D and another 3600 angle alignment between intermediate waves “a & c” (781 and 37cd = SE D).
- Dec. 19, 2011 – Jun. 6 = 892cd (SC = 3600 between intermediate waves “b & c’). At this point major wave B is anticipated to terminate on the Square’s southern axis on day 1915.
This material is a copy right excerpt from Pauline’s upcoming book Mystifying Square, Divine Proportions, the Black Box of Mother Nature.
By Pauline Novak-Reich
(Former Manager Research FX at the Australia New Zealand Banking Corporation,now author)
Contact: https://www.facebook.com/pauline.novakreich
Email: pauline.reich@optusnet.com.au
© 2014 Copyright Pauline Novak-Reich - All Rights Reserved Disclaimer: The above is a matter of opinion provided for general information purposes only and is not intended as investment advice. Information and analysis above are derived from sources and utilising methods believed to be reliable, but we cannot accept responsibility for any losses you may incur as a result of this analysis. Individuals should consult with their personal financial advisors.
© 2005-2022 http://www.MarketOracle.co.uk - The Market Oracle is a FREE Daily Financial Markets Analysis & Forecasting online publication.


