


Stock Market Update: Turn Off the TV
Stock-Markets / US Stock Markets May 05, 2008 - 01:14 PM GMTBy: Dominick
 Last week's tape is evidence of how many traders let the news get to their head, got faked out by the post-Fed selloff, and were short stocks after the meeting only to be forced to cover later in the week, sparking a rally that now has much of Wall Street bullish on stocks. But, after having pounded the table about being long above 1256, which remember was the must-hold big picture target number that had us buying the bottom during the MLK holiday hedge fund blowup and again on the retest, the widespread feelings that it's now time get into the market has us instead eyeing the exits.
Most traders, if they were able to filter out the noise and focus on charts, probably still did what they were trained to do: sell every trendline, Fibonacci retrace, divergence and moving average that appeared to suggest at least an intermediate term top in stocks. TTC, on the other hand, is proof you can do things differently.
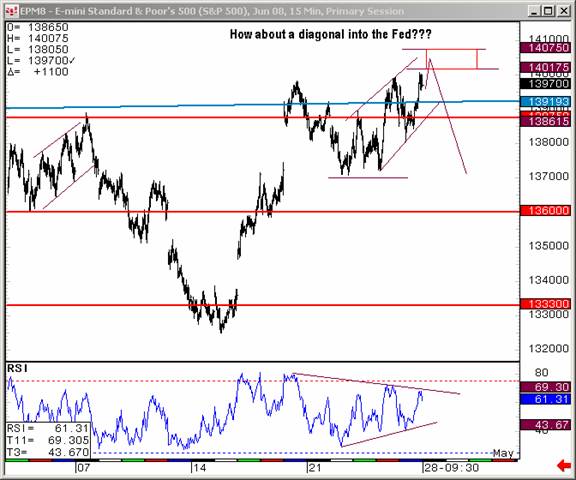
A perfect example of how TTC members eschew the news and old techniques that must motivate so many of the losing trades on Wall Street, is our recent analysis leading into the April Federal Reserve meeting. While the majority of traders attempted to guess at what the Fed's policy statement would say and how the market might react, we started the week with a firm wave pattern idea that simultaneously gave us targets on the long and short sides, as well as stops and limits for the trade. With a bit of careful money management, another important concern to TTC members, we were able to turn Fed day into a winning day with a strategy based in no way on fundamental analysis or news. The chart below shows the results of the idea posted above.
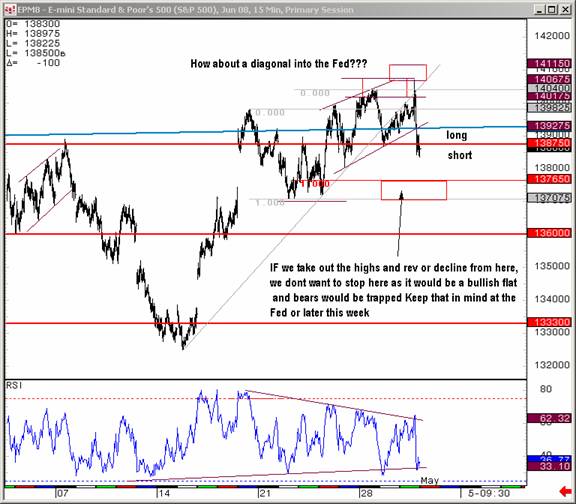
To guide us for the remainder of the week, notice the chart above anticipates the possibility of both a decline into previous support, or trades to the long side if higher levels could be held. TTC members were advised to cover shorts on Wednesday as the sudden afternoon selloff from our much expected diagonal moved into our 1387.50 number.
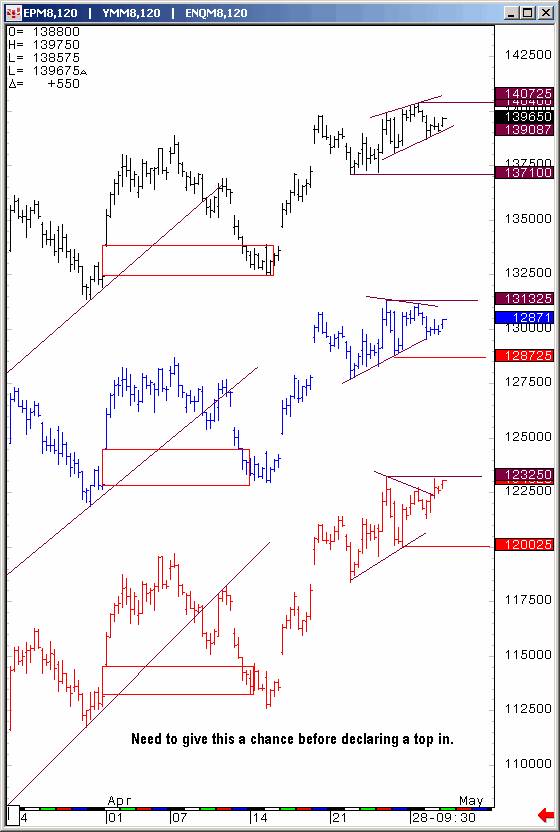
Though the wave count was quite obscured by the volatility surrounding the Fed meeting, with the market feeling comfortable trading above our crucial 1360 pivot level, we were compelled to keep our eyes on the long side of the trade. The chart below, comparing the three major U.S. indices, kept us honest in our expectations and prevented TTC members from being short too soon into what proved to be a significant gap up open Friday morning.
Of course, the other major headline of the week was the reversal in the euro, something this update has called attention to for at least the past several weeks. After recently keeping members from shorting what at first glance may have appeared to be the big reversal, members tracked the diagonal pattern below, with a well-defined target fully expected to provide the fireworks finally seen this week.
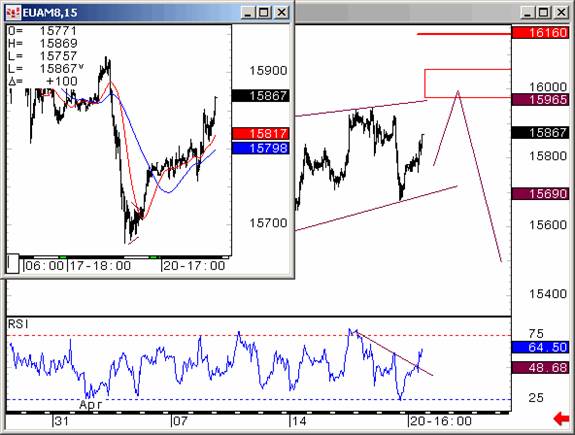
It didn't phase members knowing this diagonal idea cut against the grain of Wall Street consensus when first posted, as the dollar floundered in a morass of declining interest rates and economic expectations. Monitoring recognized levels that would invalidate the count, we knew a euro reversal would have repercussions for a wide range of markets, including the S&P 500 and precious metals.

Now that the euro has moved into the target for its selloff, consensus has shifted to trades exploiting dollar strength. Basing our outlook on our charts alone, we actually expect a tradable bounce, or something bigger, in the euro that will once again catch many off guard.
The reversal in the euro comes as the broad stock index reached considerable resistance which our proprietary trend following system, used by members on a daily, weekly and intraday timeframe, has been signaling emphasizing as a crucial make-or-break area. Ironically, market sentiment has become overwhelmingly bullish, but we continue to believe that the most important pivotal level going forward from here is in the vicinity of the 1440 area, and that price action from that level will give us the correct count for the major markets on a weekly time frame. Certainly, both bulls and bears will be fighting it out in the month of May and the winner will take all.
Also making headlines as stocks rally on dollar strength and euro weakness, is the selloff in gold, part of what many are calling the end of the commodities boom. Gold in particular is getting much of 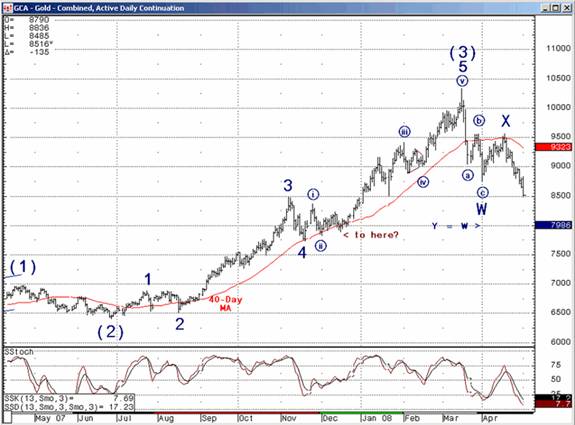
Not only does the Elliott wave count in the chart above foresee new highs in gold over the coming year, the weakness since the March highs has as a distinctly corrective look about it. A significant retracement from recent lows would corroborate the count above and fit nicely with our expectations for the euro. For more, refer to Joe's Precious Points weekly update.
In a word, the technique employed at TTC can be called “unbiased”. Liberated from preconceived notions about what the market should do, our members learn to listen to what the market is doing, and how to trade accordingly. Through our superior proprietary numbers, trend cycle indicators, cycle projections and Elliott wave analysis, TTC members are able to shut off the TV, tune out the noise and make money doing what we do best: trading the charts.
So, do you want daily updates on precious metals and other markets? Do you want to learn how to trade short term time frames? Would you like access to next week's charts posted in the weekly forum right now? Ten to twenty big picture charts are posted every weekend. But the opportunity to join the TTC community of traders is quickly slipping away from retail investors as we're set to close our doors Memorial Day weekend to all but the institutional traders that have become a large and important part of our membership. If you're really serious about trading, learn more about what TTC has to offer and how to join now .
Have a profitable and safe week trading, and remember:
"Unbiased Elliott Wave works!"
By Dominick , a.k.a. Spwaver
www.tradingthecharts.com
This update is provided as general information and is not an investment recommendation. TTC accepts no liability whatsoever for any losses resulting from action taken based on the contents of its charts, commentaries, or price data. Securities and commodities markets involve inherent risk and not all positions are suitable for each individual. Check with your licensed financial advisor or broker prior to taking any action.
Dominick Archive |
© 2005-2022 http://www.MarketOracle.co.uk - The Market Oracle is a FREE Daily Financial Markets Analysis & Forecasting online publication.