Stock Market Pattern Recognition
Stock-Markets / Technical Analysis May 05, 2008 - 03:33 PM GMTBy: Captain_Hook

 In today's increasingly mature market environment, basing one's investment decisions on the recognition of commonly followed patterns, like a ‘head and shoulders pattern', has proven to be an expensive mistake all too many times for traders throughout the past 10-years or so. This is because when a large enough body of investors / speculators get to know something, and then act on it, what may have once proven to be a reliable ‘sell signal' becomes the opposite due to betting practices of market participants in what has morphed into more of a casino than a market. With respect to the stock market today, it's fair to say this is exactly what condition our condition is in., fuelled by runaway money supply growth also characteristic of high degree market tops that can take many years to fully mature.
The following is an excerpt from commentary that originally appeared at Treasure Chests for the benefit of subscribers on Wednesday, April 16th , 2008.
As you know from previous work, it's our view that while history may not repeat exactly when it comes to the financial markets for various reasons – it all too often rhymes. It rhymes because while at the extreme technological advancement can make the current population think they have beat Mother Nature; in spite of this, human beings remain as frail emotionally / intellectually today as the generations before them, setting the stage for historical repetition. And not so strangely then, it should be of no surprise that actual trading patterns in financial markets can bare remarkable similarities at times; again, particularly at those times in history when extremes are witnessed as market participants experience the various emotional stages associated with manic capitulations.
Where are we now with respect to the stock market in this regard? In order to understand this, one must attempt to identify where we are currently in terms of the larger cycles that exist, cycles that in essence define the extremes in emotional stages discussed above. And there is no shortage of opinions out there on this subject, some good , and some not so good. For me however, and to arrive at a fundamental understanding of where we are in terms of the larger investment cycle for the stock market, believe it or not, one must arrive at an understanding of where we are terms of our currency(s), which tells us about the health of our monetary / financial system.
Why is this so important? Because it tells us how quickly the current batch of bankers are debasing the currency; or in other words, just how easy credit conditions are. Here, one must possess the root knowledge that lasting euphoric extremes in stocks generally occur when credit is at its easiest, which generally tends to coincide with those times when bankers accelerate currency debasement rates to extend good times. And if one were to examine history, you would find that the current episode of global monetary debasement is the most extreme it's ever been, primarily defined by Greenspan's tenure (and aftermath) at the Fed, unarguably non-surpassed historically in easy money creation. Hence, Greenspan has been rightfully dubbed ‘Easy Al' because of this, and the asset bubbles his irresponsible monetary policies fostered throughout the years.
So, here we are, with a top in the stock market some six-months behind us now. Interestingly however, it should be noted monetary debasement rates are still rising , with the big message here being either asset prices must continue to rise, or deflation (contracting money supply) will be signaled. Of course things are never that simple. And nor do they move in predicable straight lines. In this respect it should be noted the reason stocks have stopped rising is because the inflation (rising money supply) is making its way into commodity prices, which is causing input prices to rise, and in turn is giving already bloated stock values a problem on the cost side of the ledger.
What's more, because the primary consumer in the world, the US consumer, is getting older (meaning slowing consumption) and lacking in savings (also slowing consumption), it could be argued we are past the tipping point (in terms of the Grand Cycle ) now in the economy, where even quasi-currency measures, better known as ‘derivatives' (the extreme measures of currency debasement), are suggesting the party is over as growth slows. Moreover, perhaps the terminology ‘slowing growth' is understating the current state of affairs given the pace of derivatives losses gripping financial institutions at present, where it appears if something material is not done to stem the tide soon, losses in derivatives and stocks could spread into money supply growth rates proper. (i.e. is this a warning shot across our collective bow?)
This of course would be the icing on the cake in terms of defining a top in the larger equity / bubble complex, where ironically, and just when the West could least afford it, such a calamity would likely also burst the bond market's bubble. Here, official efforts to monetize debt markets could be overrun by sheer volume associated with foreign exposure , and the influence an unwinding process would have on equity investors once they accept the concept interest rates are heading higher. You see under such conditions they may decide to payoff debt as opposed to depending on the banking community to inflate it away. So it's important to understand that unlike any other time in history, we are currently primed for a panic as events / emotional stages unfold in our interconnected economies / markets, where it should be realized we are far closer to the beginning of a larger sequence in this regard (most are still attempting to hang on to the euphoria), than the end.
In coming full circle in terms of above opening remarks then, and the thrust of this study of course, now that a proper context has been established, it seems fitting to go back in history for an actual look at similar junctures in the past. I say ‘similar' because we must remember the current global financial crisis in the most profound in ‘modern day' history, enveloping / affecting the entire world, and unquestionably marking a turn in the de-globalization process of our larger economy. Here, it's important to realize that as economies re-regionalize to put their populations back to work with the current slowing gaining momentum, markets extending from currencies to stocks will do the same as trading environments / trust is rebuilt. And of course Peak Oil factors into the equation as well, but we will leave that discussion for another day.
For now, what we are interested in measuring is how long past financial crises of similar stature have had a tendency to affect the stock market, with last week's comments concerning the South Sea Bubble as good a place to start as any all things considered. You may remember we pointed out how the pattern in Chinese stock resembled that of the South Sea Trading Company , suggestive we are dealing with a Grand Supercycle Degree top in stocks, which would essentially involve a complete retrace of the bubble put on in 2006 and 2007. (Note how Peak Oil considerations potentially move this up into X-Wave Degree.) Further to this, note how if the current trading pattern in the Shanghai Index were to trace out a similar consolidation compared to the one on the way up in 2006, the result would be a Fibonacci resonance defined head and shoulders pattern due to release to the downside prior to the Beijing Olympics, just to keep the ironies coming.
This is of course exactly what Chinese officials are attempting to avoid. If such an outcome were to occur however, combined with accelerations in slowing economies and trade on a global basis, one could make a powerful argument Grand Supercycle Degree (minimally) forces are at work, and that one should be very careful with respect to the stock market. Here, although we certainly do not expect a 90-percent collapse of the entire stock market complex around the world, two important considerations should be noted. The first is financial / bank shares are crashing, and that the bottoms in these shares witnessed earlier this year are only temporary, where the candor associated with an unraveling process should stay brisk even if cycle related reprieves work to slow things for periods of time. Secondly, and despite personal perceptions, the stock market crash of 1929 (which was a lower Degree Affair, but still global) is a modern day example this kind of thing (a 90-percent plus loss) can happen today. (See Figure 1)
Figure 1
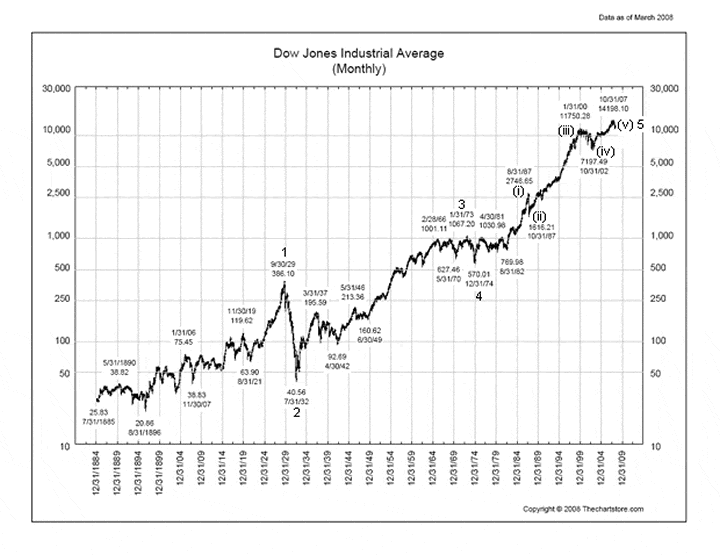
In fact, and as you can see above, the 1929 stock market crash was simply a correction of the first wave up in the Dow's Supercycle Degree advance extending out of the 1800's, where it's not uncommon for second waves to retrace 90-percent of an initial advance. What should be scary about this knowledge for the bulls is that assuming a Supercycle Degree top was in fact put in place on October 31 st of last tear at 14,198.10, and even if hyperinflation is to take the Dow to 100,000 like some extremists purport, then just a minimal 38.2-percent correction would take prices back to around 8,500, which would be a higher low than that witnessed in 2002, maintaining an ultra-long-term bullish pattern. Of course the fact the credit cycle, Fed, and US Dollar ($) are collapsing should put a damper on such thoughts, however it appears most people prefer to think in unrealistic terms indefinitely these days.
Not to be a complete party pooper however, it should be noted historical patterning precedents within the Dow's Supercycle sequence, and surrounding banking related calamities (stock market crashes and bank failures), match the current patterning very closely, with significant recoveries afterwards. The first of these was that of the 1907 Panic , which cut the Dow in half within the span of 22-months. Here, if such an outcome were to characterize the outcome of the present sequence, then the Dow would not bottom until August of 2009 at closer to the 7,000 mark. Of course with this being a year ending in ‘8', and an election year, we might be better off looking for other examples. (See Figure 2)
Figure 2
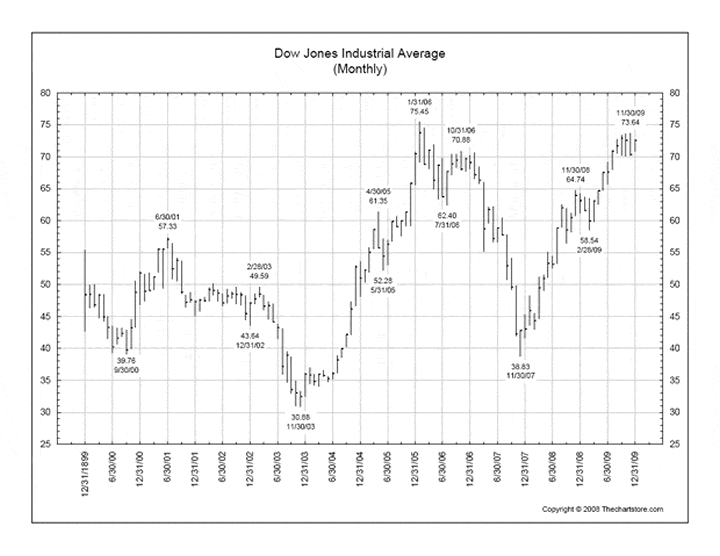
Perhaps the best context we can take away from the 1907 episode is that it was the stock market / economic / business cycle instability associated with bank failures that spawned the birth of the Fed. And therefore, in terms of our larger cycle observations above, it seems fitting that a Grand Supercycle Degree top in stocks should coincide to the Fed's demise as measured by $ hegemony and the credit cycle, both of which apparently set to fail concurrently within re-enforcing interplay. There is one more thing I wish to point out about the Dow's trading pattern in 1907 however, that being prices bottomed in March like this year, corrected higher into early May (like now), and then continued to sell-off into October, a natural time to bottom from a seasonal perspective. (See Figure 3)
Figure 3
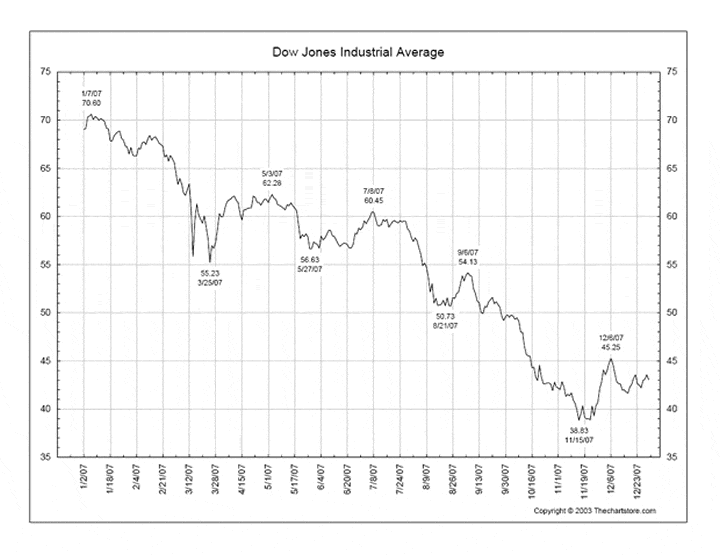
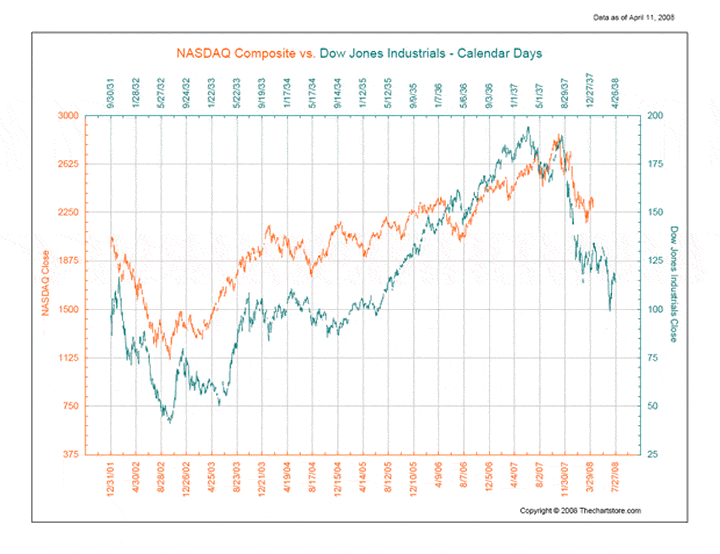
I bring this to your attention not just because such an outcome could match the present sequence in being a banking failure related incident (think Bear Stearns); but more, because of the post echo-bubble bounce aftermath witnessed in the 1937 / 38 sequence, which of course was also a derivative of the banking failures / crisis of the ‘dirty 30's'. Here, what is truly remarkable about this comparison is the high degree of resonance in Dow's trading pattern match with the NASDAQ of today, where this overlay provides unmistakable clarity in assessing. (See Figure 4)
Figure 4
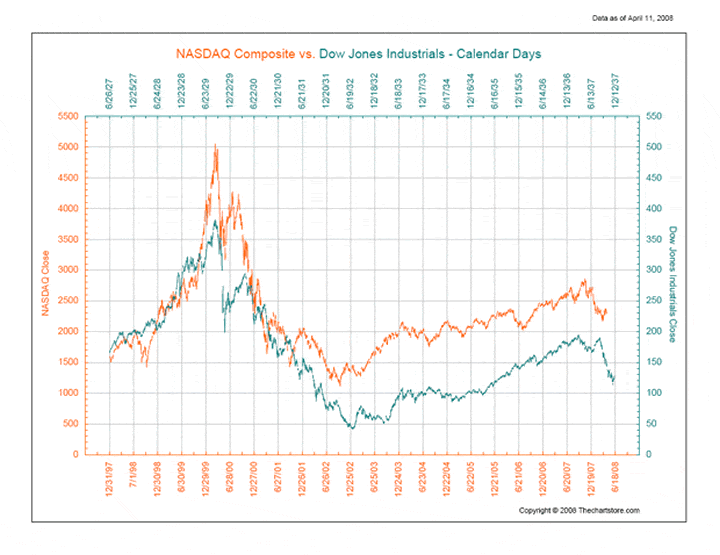
In turning the screws another notch now, notice also how the 37 / 38 sequence was also a 50-percent correction (the same as 1907), but that it only ran 12-months ending in March, which if for no other reason (not considering the election) is why many traders were looking for a bottom this March as well. Of course, if we are truly in the midst of a legitimate ‘banking crisis', this does get one wondering about the fact the Dow would need to continue selling off into October of this year to match the shorter of the two above sequences minimally, along with needing to decline another 32-percent from top to bottom in terms of magnitude. The question then arises in looking at the next chart, ‘is it any wonder a pattern similarity to that of the 1938 sequence is suggestive further losses should be anticipated into fall, with no meaningful bounces in stocks past what has already been witnessed to be expected.' (See Figure 5)
Figure 5
Unfortunately we cannot carry on past this point, as the remainder of this analysis is reserved for our subscribers. Of course if the above is the kind of analysis you are looking for this is easily remedied by visiting our newly improved web site to discover more about how our service can help you in not only this regard, but also in achieving your financial goals. For your information, our newly reconstructed site includes such improvements as automated subscriptions, improvements to trend identifying / professionally annotated charts , to the more detailed quote pages exclusively designed for independent investors who like to stay on top of things. Here, in addition to improving our advisory service, our aim is to also provide a resource center, one where you have access to well presented ‘key' information concerning the markets we cover.
On top of this, and in relation to identifying value based opportunities in the energy, base metals, and precious metals sectors, all of which should benefit handsomely as increasing numbers of investors recognize their present investments are not keeping pace with actual inflation, we are currently covering 69 stocks (and growing) within our portfolios . This is yet another good reason to drop by and check us out.
And if you have any questions, comments, or criticisms regarding the above, please feel free to drop us a line . We very much enjoy hearing from you on these matters.
Good investing in 2008 all.
By Captain Hook
http://www.treasurechestsinfo.com/
Treasure Chests is a market timing service specializing in value-based position trading in the precious metals and equity markets with an orientation geared to identifying intermediate-term swing trading opportunities. Specific opportunities are identified utilizing a combination of fundamental, technical, and inter-market analysis. This style of investing has proven very successful for wealthy and sophisticated investors, as it reduces risk and enhances returns when the methodology is applied effectively. Those interested in discovering more about how the strategies described above can enhance your wealth should visit our web site at Treasure Chests
Disclaimer: The above is a matter of opinion and is not intended as investment advice. Information and analysis above are derived from sources and utilizing methods believed reliable, but we cannot accept responsibility for any trading losses you may incur as a result of this analysis. Comments within the text should not be construed as specific recommendations to buy or sell securities. Individuals should consult with their broker and personal financial advisors before engaging in any trading activities, as we are not registered brokers or advisors. Certain statements included herein may constitute "forward-looking statements" with the meaning of certain securities legislative measures. Such forward-looking statements involve known and unknown risks, uncertainties and other factors that may cause the actual results, performance or achievements of the above mentioned companies, and / or industry results, to be materially different from any future results, performance or achievements expressed or implied by such forward-looking statements. Do your own due diligence.
Copyright © 2008 treasurechests.info Inc. All rights reserved.
Unless otherwise indicated, all materials on these pages are copyrighted by treasurechests.info Inc. No part of these pages, either text or image may be used for any purpose other than personal use. Therefore, reproduction, modification, storage in a retrieval system or retransmission, in any form or by any means, electronic, mechanical or otherwise, for reasons other than personal use, is strictly prohibited without prior written permission.
Captain Hook Archive |
© 2005-2022 http://www.MarketOracle.co.uk - The Market Oracle is a FREE Daily Financial Markets Analysis & Forecasting online publication.


