Why Gold's Base Price Should Be North Of $2,000
Commodities / Gold and Silver 2014 Jun 17, 2014 - 12:31 PM GMTBy: Steve_St_Angelo
 Even though present Geo-political events in Iraq have now pushed up the price of gold due to Brent Crude hitting a new high in 2014, the value of the yellow metal relative to oil is still way below its historical average. Currently, the price of Brent Crude is trading at $113.35, while gold is at $1,275. This is an embarrassing 11.2 to 1 ratio.... thanks to the manipulation by the Fed and member banks.
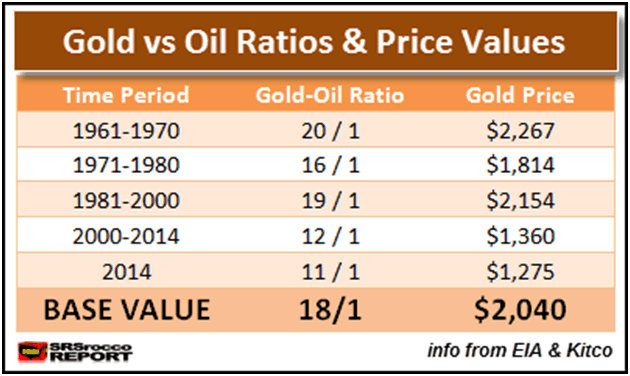
If we look at the table below, we can see the average Gold-Oil Ratios for the past 5+ decades. When the U.S. Dollar was backed by gold, the average gold-oil ratio during the 1961-1970 period was 20 to 1. Which means one ounce of gold could purchase 20 barrels of oil:

Even though gold reached $850 in 1980, we can see that the gold-oil ratio for the 1970's decade fell to 16 to 1. The reason for the decline in the gold-oil ratio during the 1971-1980 period was due to the price of oil skyrocketing in response to the U.S. oil embargo as well as a peak in domestic oil production (1971).
Very few people today realize that the price of a barrel of oil remained at a constant $1.80 from 1962-1970.... volatility was zero as the U.S. enjoyed long-term contracts. However, by 1976 the price of oil increased seven times to $12.80 (compared to $1.80), while gold was $124, only up 3.5 times (compared to $35) its value during the previous decade.
After Fed Chairman Volcker increased interest rates to double-digits, saving the the Dollar (1980), the price of gold declined from an average of $612 in 1980 to $350-$400 range in the 1981-1990 time period. During the 1980's decade the price of oil continued to decline from $36 in 1980 to a low of $14 in 1986.
Thus, the low price of oil pushed the gold-oil ratio to average 19 to 1 during the 1981-2000 period.
If we go by the price of Brent Crude which is currently trading at $113.35, we have the following values for gold:
1961-1970 (ratio 20/1) = $2,267
1971-1980 (ratio 16/1) = $1,814
1980-2000 (ratio 19/1) = $2,154
2000-2014 (ratio 12/1) = $1,360
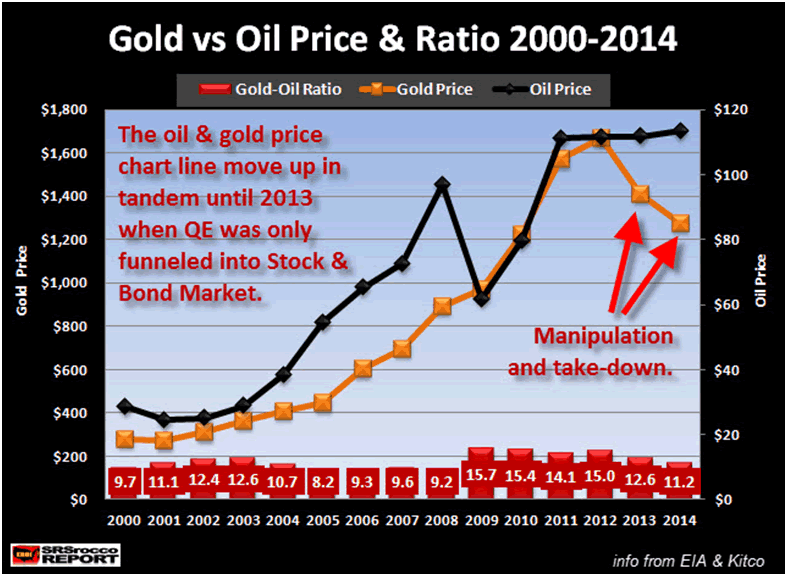
Currently, the gold-oil ratio is 11.2 to 1, with the price of gold at $1,275. This next chart shows clearly how the price of gold was manipulated lower in 2013 and 2014... pushing its gold-oil ratio well below the averages during the past four decades.

We can see from this chart that the price of gold is rising in tandem with the price of oil. In 2012, the average price of gold was $1,669 and oil $112 a barrel, at a gold-oil ratio of 15 to 1. Many of the brain-dead analysts on Wall Street at the time stated that the price of gold was overvalued.
That's an interesting statement when we realize that the average Gold-Oil ratio for 1961-2000 was 18 to 1. So how can gold at an average price of $1,669 and a gold-oil ratio of 15 to 1 in 2012 be OVERVALUED?? Hell, even at the 2012, 15/1 gold-oil ratio, it was still 3 barrels short of its previous 4 decade average.
So, today... the price of gold is $1,275 and the gold-oil ratio is 11/1. Which means an ounce of gold today buys seven less barrels of oil than it did from 1961-2000 average (18/1 ratio).
Does that seem fair when we factor in the ongoing Geo-political events taking place in the Middle East and Russia-Ukraine as well as the peaking of global oil production? If we take the average gold-oil ratio for the previous four decades of 18/1 and multiply it by the current price of Brent Crude at $113.35, we end up with a price of gold at $2,040.... or $765 higher than the current spot price.
So, the BASE PRICE of gold should be over $2,000 an ounce. I say base price because this just brings the value of gold back in line with its ratio to oil. This DOES NOT INCLUDE the huge increase in monetary printing, debt and derivatives which have funneled a great deal of value away from the King Monetary Metal.
Once we include these factors, that base price of $2,000 should be higher by several orders of magnitude. I like to use the gold-oil ratio because it gives the public-investor a BASE PRICE to go by. We can plainly see that the price of gold should already be north of $2,000... if it wasn't for the continued manipulation by the Fed and Central Banks
I've received emails from readers who believe the Gold-Oil ratio is falling because technology is becoming more efficient. BOLLOCKS. While this sounds nice at face value, the opposite is the case.
In 1970, the EROI - Energy Returned On Invested in the United States oil & gas industry was 30/1. Which means, it took the energy of one barrel of oil to produce 30 barrels for the market. Today, that EROI ratio is down to 10/1. Moreover, the U.S domestic Shale oil industry with a 5/1 EROI makes the situation even worse -- if not dire.
Lastly, all those who believe OIL SHALE in the western part of the U.S. with a supposed resource of over 1 trillion barrels is going to save us... think again. Oil shale with an EROI of 1.5-2/1 doesn't pay the ENERGY BILLS... however, it's a nice joke to share among oil geologists and engineers.
By the Fed and top banking institutions rigging the precious metals market to a low Gold-Oil ratio of 11/1, means that when the price revalues higher... IT WILL DO SO SHARPLY and painfully so for those on the wrong side of the trade or in worthless paper assets.
Please check back for updates at the SRSrocco Report and you can also follow us at Twitter:
2014 Copyright Steve St .Angelo - All Rights Reserved Disclaimer: The above is a matter of opinion provided for general information purposes only and is not intended as investment advice. Information and analysis above are derived from sources and utilising methods believed to be reliable, but we cannot accept responsibility for any losses you may incur as a result of this analysis. Individuals should consult with their personal financial advisors.
© 2005-2022 http://www.MarketOracle.co.uk - The Market Oracle is a FREE Daily Financial Markets Analysis & Forecasting online publication.


