


Gold Stocks 2014 Winning Surprise!
Commodities / Gold and Silver Stocks 2014 Jun 21, 2014 - 07:11 AM GMTBy: Ned_W_Schmidt

 Half of 2014 is nearly behind us, and little is turning out as popularly expected. That is unless one was watching development of the past year with an unbiased view. As can be observed in the following chart, the GDX, a Gold stock ETF, has been a stellar performer thus far this year. The return on that ETF has far exceeded that widely available in most of the equity markets, and certainly far more than the NASDAQ, a market filled with Techno/Junk. Part of the reason for that stellar performance is that $Gold, Agri-Food Prices, and oil have all staged nice rallies based on strong demand, which was certainly not anticipated by most of the investment community.
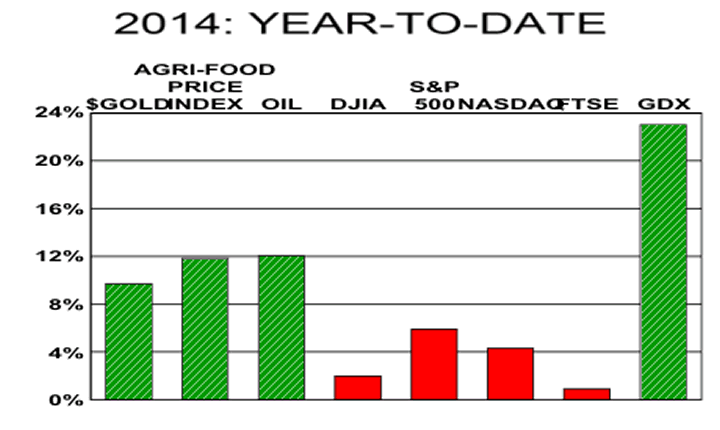
The change in the ranking of returns being observed this year is not a chance event. Rather, these returns flow from fundamental changes taking place. Gold has risen this year as the dollar, measure by an unbiased index of foreign currencies, peaked in January. Foreign exchange markets have correctly assessed the dismal outlook for both the U.S. economy and stock market.
Agri-Food prices have risen on continued strong demand. The Federal Reserve maybe able to create high-powered money, but it cannot produce a calf. A popular media report this past week has been "Price Index for Meats, Poultry, Fish & Eggs Rockets to All-Time High" by Ali Meyer of cnsnews.com, 17 June. Per this report,
"The seasonally-adjusted price index for meats, poultry, fish, and eggs hit an all-time high in May, according to data from the Bureau of Labor Statistics (BLS). In January 1967, when the BLS started tracking this measure, the index for meats, poultry, fish, and eggs was 38.1. As of last May, it was 234.572. By this January, it hit 240.006. ByApril, it hit 249.362. And, in May, it climbed to a record 252.832."
The movement higher in Agri-Food prices is not a transitory event, but rather is the consequence of rising demand around the world. Prices for U.S. feeder steers are at all time highs, suggesting that the end to the rising price of beef is not likely till next year. Steaks are not produced in a factory. Corn and soybeans have recently been selling in the U.S. at prices that will likely be lifetime lows. The food in your freezer has outperformed most equity portfolios thus far in 2014, and will likely continue to do so.
Out of the above comes an important question. Will the rising prices for the above commodities combine with the irresponsible monetary policy of the U.S. in recent years to cause inflation to rise? The chart below suggests that yes might be the answer to that question.
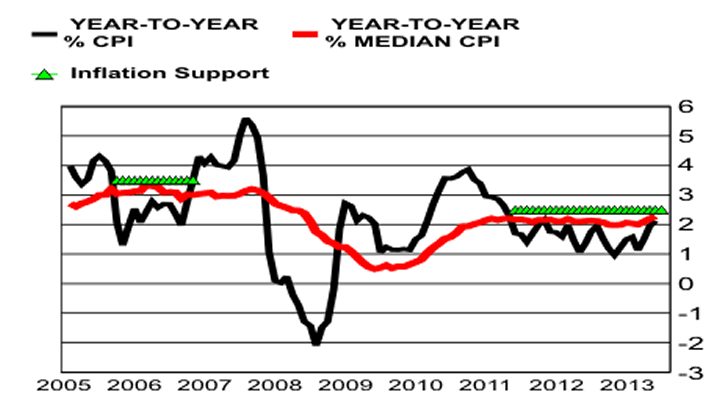
In the above chart, created using data from the Cleveland Federal Reserve Bank, the solid black line is the year-to-year change for the U.S. consumer price index. Red line, which may be of more interest, is the year-to-year percentage change for the median CPI produced by the Cleveland Fed. That index is the median monthly change for the components of the CPI. Half of the component measures rose by more than the median and half have monthly changes below that measure. The median value is not as strongly influenced by extreme values and the fundamental flaws in the construction of many components of the broad CPI. For those reasons, it may be a more useful measure of central tendency.
In that chart two periods have been highlighted by lines of green triangles, labeled Inflation Support for lack of a better term. Note that in the early part of the graph, the year-to-year change for the median CPI persisted at or slightly above 3%. During that time period the headline CPI rate of change plunged to a near 1% rate of change. The median CPI was telling us that the headline CPI was incorrectly assessing inflationary pressures. From ~2% in 2007 U.S. inflation rose to more than 5%, or more than doubled.
Now consider the most recent era. Again, the median CPI is suggesting that the headline CPI is giving a false impression of inflationary pressures. The information provided by the median CPI combined with the fact that the popular CPI measure has already turned up suggests that U.S. inflation is headed higher. Will it only "double" this time? Or will the combination of global needs for Agri-Food and oil send it for higher?
In a world of potentially higher U.S. inflation when the Federal Reserve is already tightening, investment complacency could be a costly error. Relying on fantasies of higher U.S. economic growth could cost considerable money. The most vulnerable group of equity investments in such an environment would be the "growth" stock fantasies which have again become so popular. Investing in "value" stocks, which has been shown to be far more successful on a historic basis, should regain investor interest. That suggests investors take a closer look at Agri-Equities and Gold.
Ned W. Schmidt,CFA is publisher of The Agri-Food Value View, a monthly exploration of the Agri-Food Super Cycle, and The Value View Gold Report, a monthly analysis of the true alternative currency. To contract Ned or to learn more, use either of these links: www.agrifoodvalueview.com or www.valueviewgoldreport.com
Ned W Schmidt Archive |
© 2005-2022 http://www.MarketOracle.co.uk - The Market Oracle is a FREE Daily Financial Markets Analysis & Forecasting online publication.