


Stock Market Getting Frothy ?
Stock-Markets / Stock Markets 2014 Jun 28, 2014 - 08:04 PM GMTBy: Tony_Caldaro

 The general market made a new bull market high on Tuesday at SPX 1968, dropped to 1945 by Thursday, and then rallied to 1961 to end the week. For the week the SPX/DOW were -0.35%, the NDX/NAZ were +0.90%, and the DJ World index was -0.25%. Economic reports for the week were slightly positive. On the uptick: existing/new home sales, personal income/spending, consumer confidence/sentiment and PCE prices. On the downtick: Q1 GDP, Case-Shiller, durable goods orders, the LEI and the monetary base. Next week we get reports on Nonfarm payrolls, ISM and the Chicago PMI.
MARKET VALUATION: Wilshire 5000 v US GDP
This week Q1 GDP 2014 was reported lower than the previous quarter for the first time since Q2 2009. The end of the great recession. While the stock market took this information in stride, blaming the decline on the weather, we are starting to get concerned about market valuations. The best day-to-day measure of the total equity market capitalization in the US, is the Wilshire 5000.
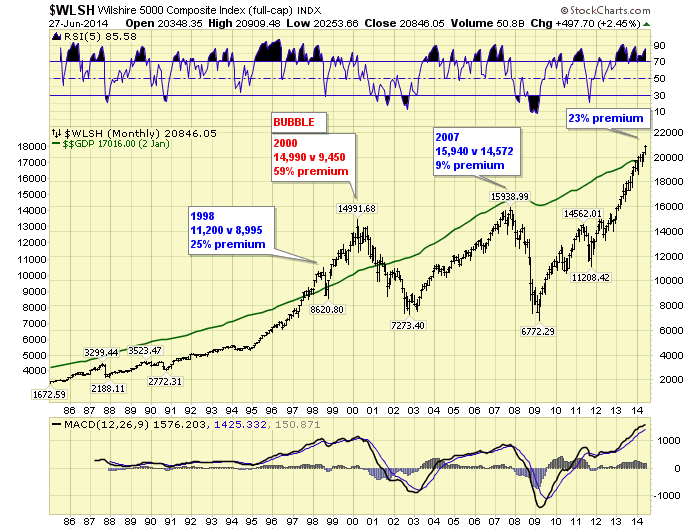
On Tuesday, the day before the GDP report, the Wilshire 5000 hit $20.909tn. With GDP currently at $17.016tn, this represents a 23% premium over the total economy in the US. Of course, lots of US companies do lots of business overseas. Since the mid-1980′s, however, a total market cap with this kind of premium over the GDP has only been reached twice: 1998 and 2000. Notice the 2007 high, which was also an all time high, was only a 9% premium over the GDP. And prior to 1997, bull markets topped before even reaching a premium. The stock market certainly looks a bit frothy at current levels.
LONG TERM: bull market
The bull market hit a new high this week. At the high it was +6.5% for the year with nearly six months completed. Last year the market gained 29.6% for the entire year. This market does appear to be struggling at these lofty valuations.
We continue to count this bull market as Cycle wave [1] consisting of five Primary waves. Primary waves I and II completed in 2011 and Primary wave III has been underway since then. When it concludes, which could occur in the next few months, the market could experience its largest drop since the 22% decline during Primary II in 2011.
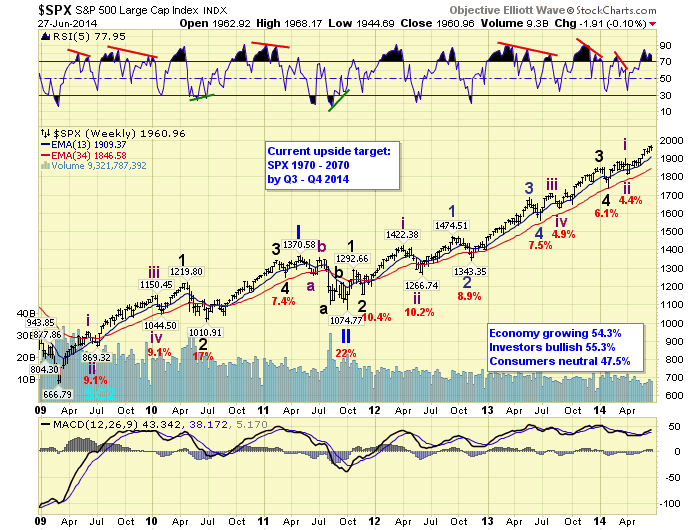
Currently Primary III is in its fifth wave, Major wave 5, from the October 2011 low. Major waves 1 and 2 completed in late-2011, and Major waves 3 and 4 completed in early-2014. Major wave 5, however, is subdividing into five Intermediate waves. Intermediate waves i and ii completed in April, and Intermediate iii has been underway since that low. When this Int. iii uptrend ends we should see a small correction for Int. iv. Then another uptrend to new highs to end Major 5 and Primary III. We have been expecting a June high, July low, August high. But the current uptrend may stretch into July.
MEDIUM TERM: uptrend
The current uptrend, Intermediate wave iii, has been rising since mid-April at SPX 1814. We have been counting it as five Minor waves with a subdividing Minor wave 3. Minor waves 1 and 2 ended at SPX 1885 and 1851 respectively, and Minor wave 3 ended just this week at 1968. Minor wave 3 was approximately 1.618 times Minor wave 1. We are currently expecting Minor wave 4 to unfold, before Minor wave 5 takes the market to new highs and completes the uptrend.
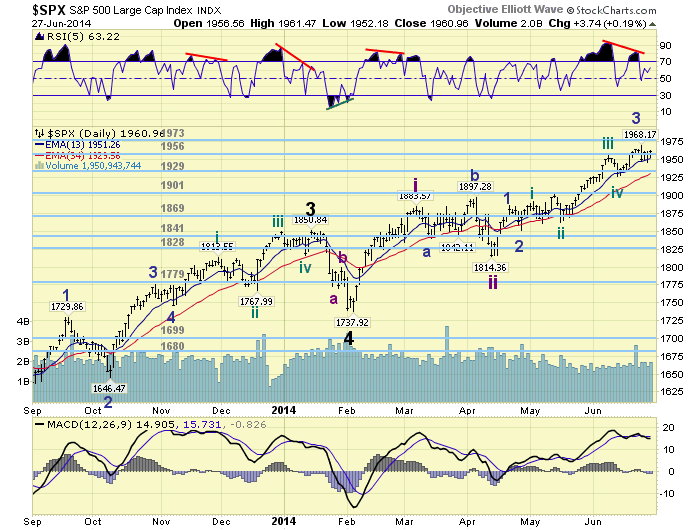
This week we had a decline from SPX 1968: 1947-1961-1945. Originally we labeled this as Minute waves ‘a’ and ‘b’ expecting Minute ‘c’ to follow. The market, however, rallied back to SPX 1961 on Friday and closed there. This suggest this three wave decline was only Minute ‘a’ of an expected Minute a-b-c Minor wave 4. The current rally is probably Minute ‘b’. When it concludes, momentum ended the week overbought, Minute ‘c’ should follow. We have been expecting the market will find Minor 4 support around the OEW 1929 pivot. Medium term support is at the 1956 and 1929 pivots, with resistance at the 1973 and 2019 pivots.
SHORT TERM
Short term support is at the 1956 and 1929 pivots, with resistance at the 1973 and 2019 pivots. Short term momentum ended the week overbought. The short term OEW charts are positive with the reversal level now SPX 1956.
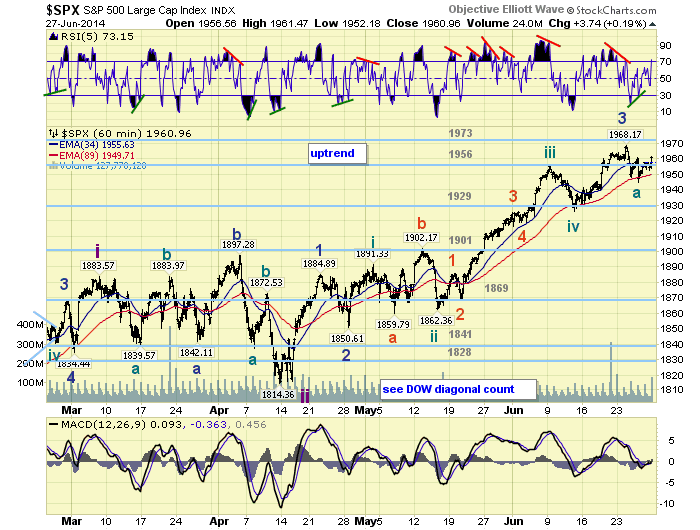
The hourly chart displays the entire movement of all the waves within this uptrend to date. Notice many of the pullbacks were quite short in time and similar in price. The pullbacks have generally taken 2 to 4 days, ranging between 31 and 40 points. Thus far, the current pullback has only has a 2 day (Tues.-Thurs.) 23 point decline. After a two month Minor wave 3 advance this appears to be too short, and small, for a Minor wave 4. The NDX made a new high on Friday, while the NAZ came within one point of its high. When they rollover the SPX/DOW will probably finish Minor wave 4.
FOREIGN MARKETS
The Asian markets were mixed on the week gaining 0.1%.
The European markets were all lower losing 2.6%.
The Commodity equity group were mixed and lost 0.7%.
The DJ World index is still uptrending but lost 0.3%.
COMMODITIES
Bonds remain in a downtrend but gained 0.6%.
Crude is still uptrending but lost 0.8%.
Gold remains in an uptrend and gained 0.1%.
The USD appears to be downtrending and lost 0.4%.
NEXT WEEK
Monday: Chicago PMI at 9:45 and Pending home sales at 10am. Tuesday: Construction spending, ISM manufacturing and Auto sales. Wednesday: the ADP index and Factory orders. Thursday: Monthly payrolls (est. +220k), weekly Jobless claims, the Trade deficit and ISM services. Friday: Independence day holiday. On Wednesday FED chair Yellen gives a speech at the IMF on Financial Stability. Best to your weekend and week!
CHARTS: http://stockcharts.com/public/1269446/tenpp
http://caldaroew.spaces.live.com
After about 40 years of investing in the markets one learns that the markets are constantly changing, not only in price, but in what drives the markets. In the 1960s, the Nifty Fifty were the leaders of the stock market. In the 1970s, stock selection using Technical Analysis was important, as the market stayed with a trading range for the entire decade. In the 1980s, the market finally broke out of it doldrums, as the DOW broke through 1100 in 1982, and launched the greatest bull market on record.
Sharing is an important aspect of a life. Over 100 people have joined our group, from all walks of life, covering twenty three countries across the globe. It's been the most fun I have ever had in the market. Sharing uncommon knowledge, with investors. In hope of aiding them in finding their financial independence.
Copyright © 2014 Tony Caldaro - All Rights Reserved Disclaimer: The above is a matter of opinion provided for general information purposes only and is not intended as investment advice. Information and analysis above are derived from sources and utilising methods believed to be reliable, but we cannot accept responsibility for any losses you may incur as a result of this analysis. Individuals should consult with their personal financial advisors.
Tony Caldaro Archive |
© 2005-2022 http://www.MarketOracle.co.uk - The Market Oracle is a FREE Daily Financial Markets Analysis & Forecasting online publication.