


Dow and FTSE100 Stock Market Updates
Commodities / Global Stock Markets Jul 03, 2014 - 10:36 AM GMTBy: Austin_Galt

 Let’s start with the Footsie daily chart.
Currently the Footsie is tracking out exactly as laid out in my previous report. That requires one more pop up into a top above the recent top of 6895 but should be held by the 1999 top of 6951. The recent drop had a couple of hits against the lower Bollinger Band and has now made its way back to the top band signifying the final move to high is now underway.
FOOTSIE DAILY CHART
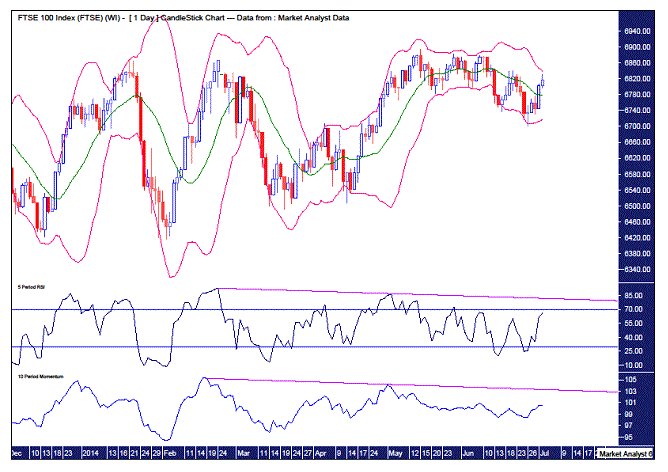
I have added a Relative Strength Indicator (RSI) and a Momentum Indicator. It can be seen that since the February and May highs, each high has been losing both strength and momentum. This final high, quite possibly this month, should see a third bearish divergence in both indicators. That could be expected to then lead to a significant decline and probably signal the end of the bull market that has been in force since March 2009.
Now let’s take a look at the daily chart of the Dow Jones Industrial Index.
DOW DAILY CHART
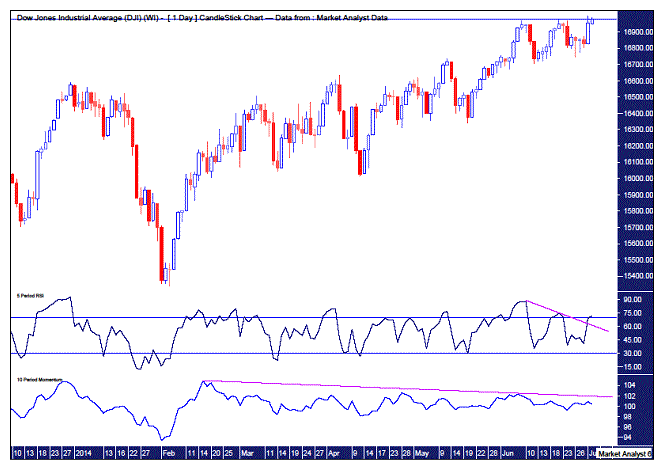
I have drawn a horizontal line across the two recent tops in June. This area is just below the key psychological level of 17000. Importance is often given to such big and round numbers. (Remember Dow 10000?) I originally thought the final high may be just below this level. However, now with recent testing of this level there must be quite a few stop loss orders building above this level just waiting to get taken out. That should see the Dow pop higher in one last short covering rally.
I’ve also added the RSI and Momentum indicators. The RSI has broken the bearish divergence shown from the June tops and this also suggests a surge is set to take place. The Momentum Indicator shows the uptrend since February is just about out of puff. Not long to go now folks!
Now going back to my Footsie analysis, in my previous report I stated I expected a high between 6895 and 6951. I still stand by this prediction. If that is correct then with the Footsie currently just above 6800 then the top should be around 1.5% to 2% higher than current levels. If we apply the same move higher to the Dow then we could expect the Dow to top around 250 to 350 points higher from current levels. That would project a top around 17200 to 17300. And I’ve still got the next major Bradley Model turn date of 16th July 2014 in mind. And with the market seemingly heading up into that date then that could quite possibly be the topping time period. Let it roll…………
Note – please email me if you are interested in reading my recent technical analysis articles on both the Footsie and Dow.
Bio
I have studied charts for over 20 years and currently am a private trader. Several years ago I worked as a licensed advisor with a well known Australian stock broker. While there was an abundance of fundamental analysts there seemed to be a dearth of technical analysts, at least ones that had a reasonable idea of things. So my aim here is to provide my view of technical analysis that is both intriguing and misunderstood by many. I like to refer to it as the black magic of stock market analysis.
Please register your interest in my website coming soon. Any questions or suggestions, please contact austingalt@hotmail.com
© 2014 Copyright Austin Galt - All Rights Reserved
Disclaimer: The above is a matter of opinion provided for general information purposes only and is not intended as investment advice. Information and analysis above are derived from sources and utilising methods believed to be reliable, but we cannot accept responsibility for any losses you may incur as a result of this analysis. Individuals should consult with their personal financial advisors.
© 2005-2022 http://www.MarketOracle.co.uk - The Market Oracle is a FREE Daily Financial Markets Analysis & Forecasting online publication.