


Two Buy Signals in Crude Oil
Commodities / Crude Oil Jul 26, 2014 - 09:21 PM GMTBy: Investment_U

Christopher Rowe writes: To help us analyze this chart of light, sweet crude oil, let’s use two momentum indicators:
- The MACD (Moving Average Convergence Divergence) indicator
- The RSI (Relative Strength Index – not to be confused with “relative strength”).
The main portion of the chart shows the price action of light, sweet crude oil.
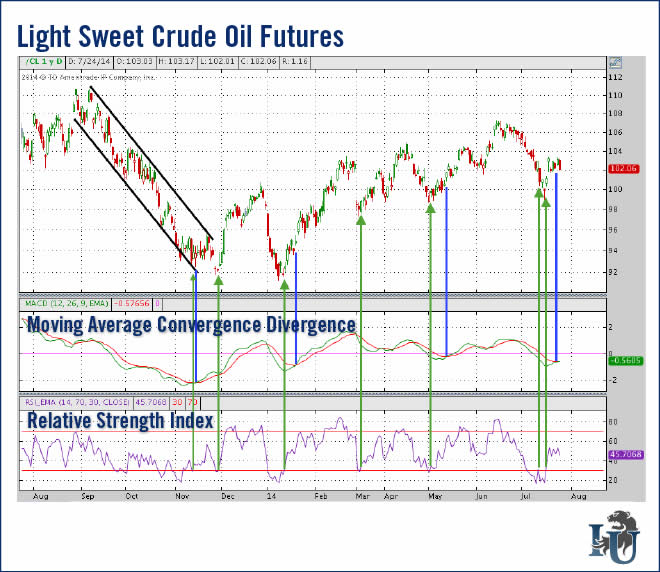
Just below the price action portion of the chart is the MACD indicator.
In this chart, the “MACD line” is green and the “signal line” is red. The signal line is the moving average of the MACD line, which is why it’s a bit slower to move.
There are two main requirements for a true MACD “Buy” signal. First, the MACD line must cross from below to above the signal line. Second, this must happen below the zero line (which is the midpoint of the indicator). “Buy” signals given when a price chart is in a downtrend are unreliable.
I pointed out some MACD “Buy” signals with the blue lines in the chart. The MACD just gave us a “Buy” signal on Wednesday.
At the bottom we have the RSI. When the RSI crosses above the 30 line, it’s a “Buy” signal. I drew green arrows from every legitimate RSI “Buy” signal to show where the price of light, sweet crude oil was at the time.
Notice I said “legitimate” RSI “Buy” signal. In relation to the MACD “Buy” signals, RSI “Buy” signals that are given when a price chart is in a downtrend are unreliable entry points for bullish positions. They become legitimate when the RSI makes a higher low that matches the lower lows in the price chart (a “positive divergence”). An example of this is the RSI “Buy” signal seen in November 2013.
Notice how the RSI gave us a “Buy” signal just over a week ago.
No indicator has a perfect track record. But these two momentum indicators are telling us light, sweet crude could be making a profitable move.
Source: http://www.investmentu.com/article/detail/39036/technical-analysis-two-buy-signals-crude-oil
Copyright © 1999 - 2014 by The Oxford Club, L.L.C All Rights Reserved. Protected by copyright laws of the United States and international treaties. Any reproduction, copying, or redistribution (electronic or otherwise, including on the world wide web), of content from this website, in whole or in part, is strictly prohibited without the express written permission of Investment U, Attn: Member Services , 105 West Monument Street, Baltimore, MD 21201 Email: CustomerService@InvestmentU.com
Disclaimer: Investment U Disclaimer: Nothing published by Investment U should be considered personalized investment advice. Although our employees may answer your general customer service questions, they are not licensed under securities laws to address your particular investment situation. No communication by our employees to you should be deemed as personalized investment advice. We expressly forbid our writers from having a financial interest in any security recommended to our readers. All of our employees and agents must wait 24 hours after on-line publication or 72 hours after the mailing of printed-only publication prior to following an initial recommendation. Any investments recommended by Investment U should be made only after consulting with your investment advisor and only after reviewing the prospectus or financial statements of the company.
Investment U Archive |
© 2005-2022 http://www.MarketOracle.co.uk - The Market Oracle is a FREE Daily Financial Markets Analysis & Forecasting online publication.