


Silver Prices – Megaphone Patterns
Commodities / Gold and Silver 2014 Jul 29, 2014 - 06:55 PM GMTBy: DeviantInvestor

 President Nixon closed the “gold window” in August 1971. That decision enabled the exponential growth of debt, paper currencies, and prices. A few examples:
Item 1971 2014
US National Debt $ 398 Billion $17,500 billion ($17.5 Trillion)
Dow Index 900 16,900
Gold Price $41 $1300
Silver Price $1.39 $21
Crude Oil $2.20 $102
New Automobile $2,700 $32,000
The process is simple and clear. Remove the gold backing from the dollar, enable the creation of nearly unlimited dollars and debt, many more dollars chase somewhat more goods, prices increase, proclaim it is “all good” and then create even more dollars and debt.
So what about silver?
Silver prices have increased but in a disorderly manner. Rather than focus on details, examine the big picture – 43 years of monthly price data in one chart – and divide that 43 year period into four “megaphone” shaped patterns on a log-scale chart. See below:
Silver Megaphone Patterns
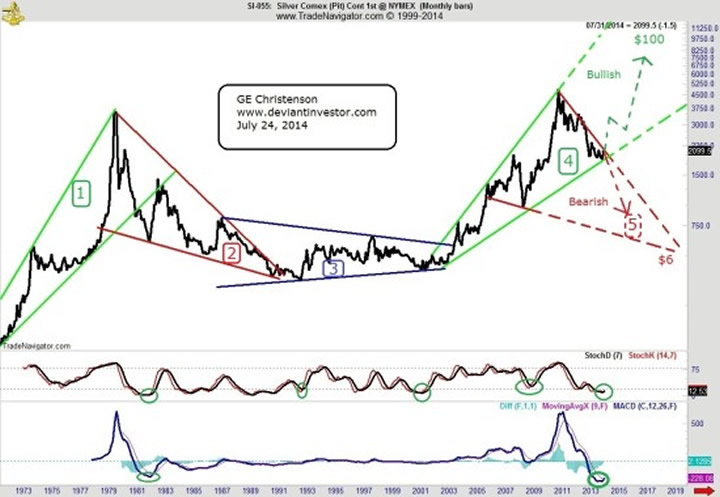
Zone 1: Silver accelerated higher from $1.39 in 1971 to about $50.00 in January 1980 – a massive bubble.
Zone 2: Silver crashed (bubbles always crash) down to $3.50 in 1991. In nominal dollars, this was a loss of about 93%. Adjusting for inflation it was even larger.
Zone 3: Silver “flatlined” for a decade and moved from about $3.50 in 1991 to about $4.00 in 2001.
Zone 4: Silver rallied post 9-11 in a new bull market from about $4.00 in 2001 to nearly $50 in 2011.
How will silver prices change in the next five years?
Door # 1: The upward slanting megaphone pattern continues and silver surges to $100 or more by 2016 – 2019.
or
Door # 2: A new megaphone pattern slanting downward (shown in red as # 5) has begun and will terminate at perhaps $6 in the 2016 – 2019 time period.
There are other choices than these two options, but it seems likely (to me) that silver prices will move much higher, while it is remotely possible that silver prices will continue their downward collapse, as represented by the above options.
The Bullish Choice – Door # 1:
- Prices have been increasing since 1913 and rising more strongly since 1971. I see little to change this, short of a nuclear winter.
- Global debt exceeds $200,000,000,000,000 ($200 Trillion) and is rapidly rising. We should plan on more crashes and bubbles in stocks, bonds, and currencies. Fear and a desire for safety will drive more investors into silver and gold at much higher prices.
- The Stochastic and MACD indicators shown at the bottom of the graph show low readings that have consistently indicated bottoms in prices. Other technical indicators show similar “over-sold” conditions.
- Silver prices are currently more than 55% off their highs. They have considerable room to accelerate higher.
- The cost of silver production has been reported at about $20 per ounce. With energy prices increasing, that cost of production will also increase. I see little chance that silver prices will drop below $10 as the cost of production increases to $30 or considerably more.
- Most government stockpiles of silver in the western world are gone.
- New industrial uses for silver are discovered every day. Solar panel uses for silver will increase.
- Many more not listed here.
The Bearish Choice – Door # 2.
(Sarcasm alert! I do not take the bearish view as a serious alternative.)
- The governments of the US, UK, Europe, and Japan will become efficient, will wisely manage their resources and will no longer need to borrow massive quantities of their currencies in order to pay their bills. Consequently we should expect price stability or mild deflation in food, energy, and silver prices. Okay, just kidding…
- Central banks have chosen to wisely manage their currencies for the benefit of the citizens and are “printing” in moderation because they wish to avoid dangerous increases in prices, debt, and the money supply. Okay, just kidding again.
- “Silver-Bugs” are likely to sell their stacks of silver and buy call options on the S&P because they feel the S&P is a safer and better investment. Sorry, getting ridiculous now…
- Too-Big-To-Fail banks and bullion banks are forecasting flat to lower gold prices through the end of the decade. Many individuals and money-managers still trust these banks and actually believe their self-serving propaganda. This misinformation negatively affects the prices for paper silver.
- Even though silver has been money for thousands of years, it has been replaced by a superior alternative – pieces of colored paper. Back to just kidding…
CONCLUSIONS:
Over 40 years of silver prices can be represented by four zones of megaphone shaped price patterns. My interpretation is that zone 4 – a long and aggressive move upward – is still in progress. My round number target is $100 or more in 2016 – 2019. Although I hope that the powers-that-be will not choose to create hyperinflation in the US, if hyperinflation does occur, the $100 target will be easily bypassed and much higher prices will be “in play.”
GE Christenson aka Deviant Investor If you would like to be updated on new blog posts, please subscribe to my RSS Feed or e-mail
© 2014 Copyright Deviant Investor - All Rights Reserved Disclaimer: The above is a matter of opinion provided for general information purposes only and is not intended as investment advice. Information and analysis above are derived from sources and utilising methods believed to be reliable, but we cannot accept responsibility for any losses you may incur as a result of this analysis. Individuals should consult with their personal financial advisors.
© 2005-2022 http://www.MarketOracle.co.uk - The Market Oracle is a FREE Daily Financial Markets Analysis & Forecasting online publication.