


Gold Price Bullish Falling Wedge
Commodities / Gold and Silver 2014 Aug 04, 2014 - 03:19 PM GMTBy: Clive_Maund

 We called the exact top in gold to the day in the last update 3 weeks ago, as it has since reacted back. Now the picture is more messy, with conflicting indications, but let's see what we can make of it. There was no update for these 3 weeks as we were waiting for this decline to run its course (no point in working for the sake of it).
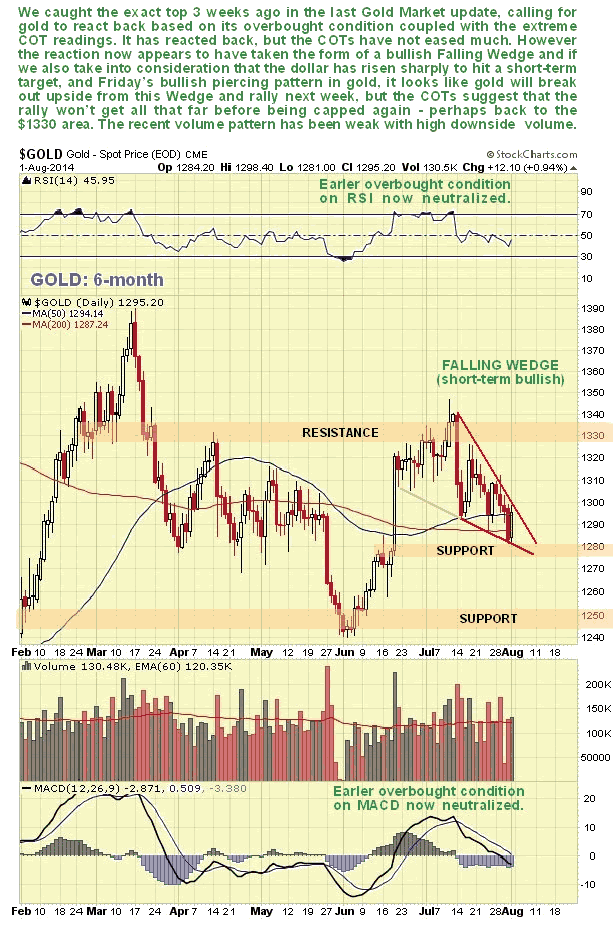
On the 6-month gold chart we can see how the forecast decline was kicked off by a sharp drop, but as it has proceeded it has diminished in force, and it now looks like the minor downtrend has developed into a bullish Falling Wedge. With this Wedge now closing up a breakout and rally looks imminent, made more likely by a "piercing pattern" appearing on the chart on Friday, and also by the strong dollar having hit a short-term target in a very overbought state on Wednesday and Thursday, which we will look at shortly. It was this strong dollar which forced gold and silver lower in recent weeks. Disappointing for bulls, however, is the fact that the extreme COT readings of a few weeks back have not eased off much.
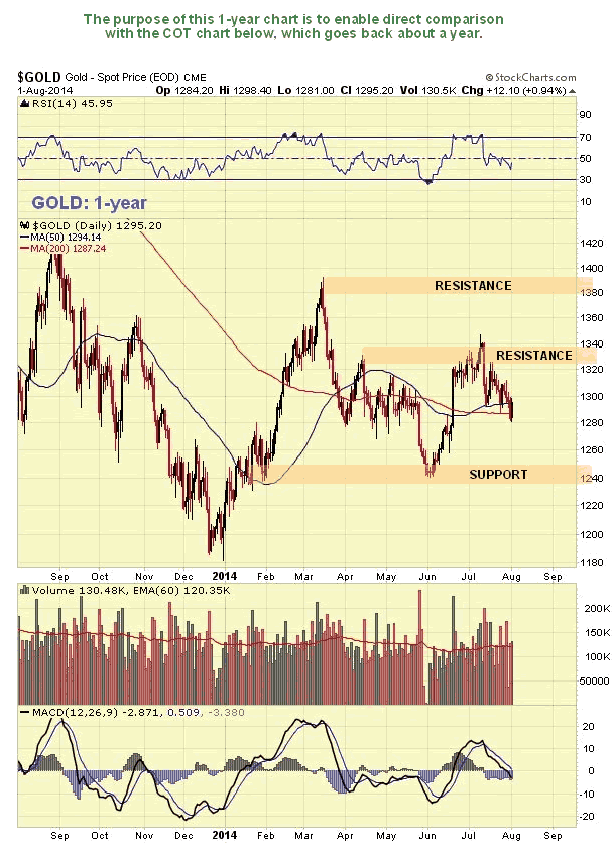
The 1-year chart for gold is shown below for the purposes of comparing it to the COT chart immediately below it...
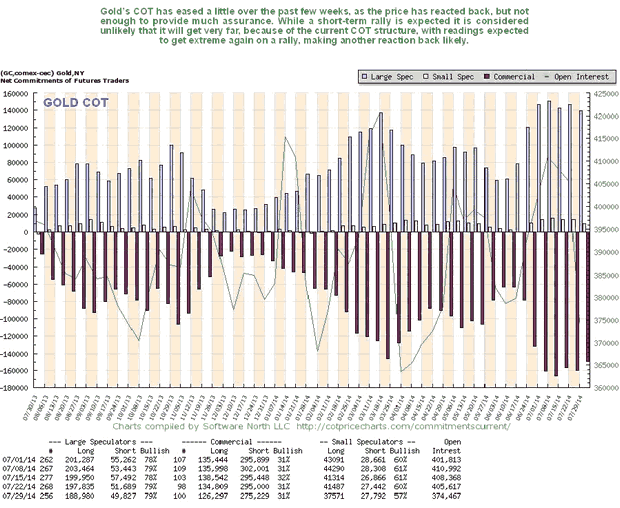
Gold's COT structure has eased on the reaction back of recent weeks, but not enough to provide much cheer for the bullish camp...
The 4-year chart for gold is interesting as it enables us to examine to advantage the potential base pattern forming in gold for over a year. Many analysts have been grappling to define this pattern, which is not a Head-and-Shoulders bottom nor a normal Triangle, but something else. It is now thought that it is probably a "Fish-Head" Triangle, which is a type of Triangle where its boundaries converge at an increasingly rapid rate. As we can see, if it is a true Fish Head Triangle, then breakout is imminent, and as with normal Triangles, breakout can be in either direction.
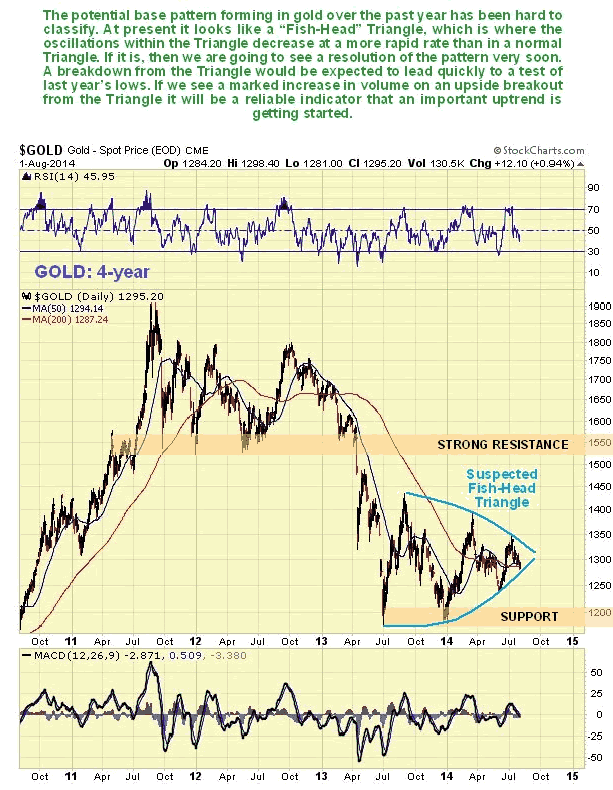
Given the geopolitical mayhem of recent weeks, with Russia being singled out as the new enemy by the Military - Industrial complex, for reasons set out in Why they are making an enemy of Russia, which is now a freely available article, and Israel running amok in Gaza, gold has been surprisingly weak, even given the negative influence of the strong dollar rally, and the continuing high COT readings do not help the bullish case either. So, although we are expecting a relief rally by gold as the dollar consolidates or reacts back, it is important note that it may not succeed in breaking out upside from the Triangle, at least not yet.
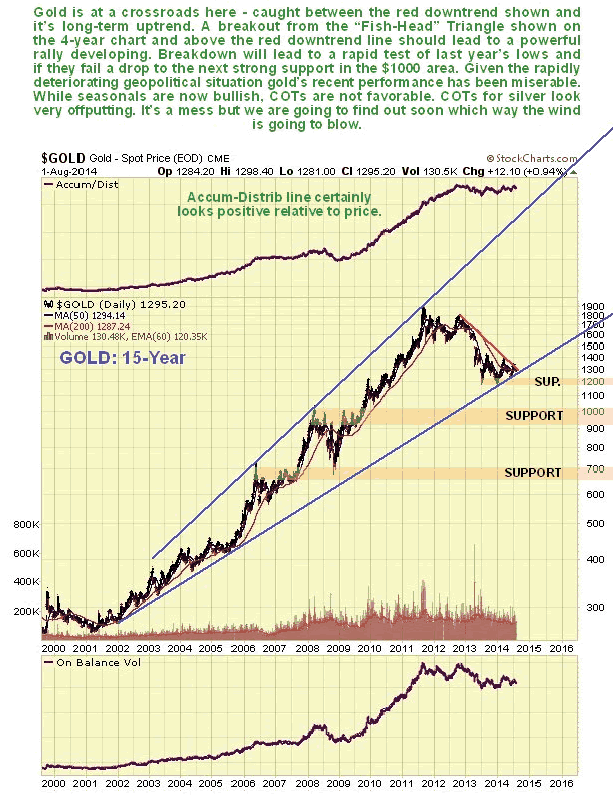
The long-term 15-year chart shows that gold is at a critical juncture, as it is cornered between the falling red downtrend line shown, and its long-term uptrend support line. This is the perfect point for a major new uptrend to start, and seasonals are favorable, but the COTs don't look positive.
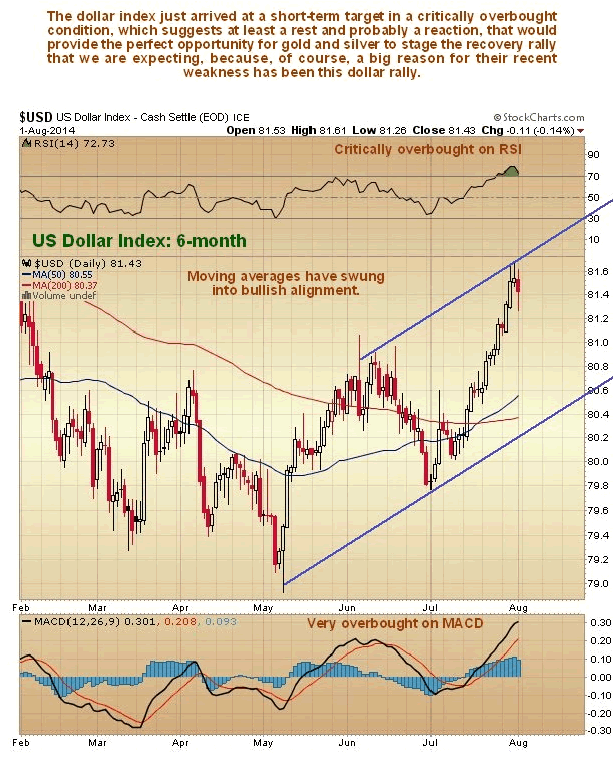
On the 6-month dollar index chart we can see how it arrived at a trendline target in an overbought state last week, and then started to react back on Friday. Further consolidation/reaction looks likely, although the dollar could start a moonshot if the stockmarket crashes soon, and here we should note that Treasuries are unlikely to provide safe haven as they did in 2008. This because, after years of extraordinarily low interest rates, rates are now almost at zero, so the only way for them to go is up, and if that happens bond prices should crash too, along with the stockmarket. This will be the result of the economy growing at a considerably faster clip than expected putting upward pressure on interest rates in an environment of debt saturation and the Fed backing out of asset purchases too late, as usual.
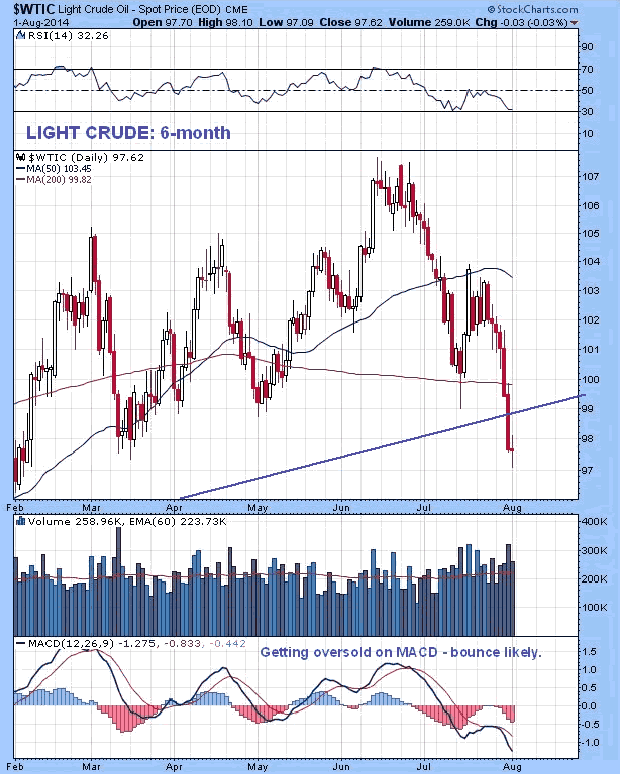
Meanwhile, on the 6-month chart for Light Crude, we can see that it has been surprisingly weak in the recent past, given what has been going in the Mid-East and with Russia, and it is noteworthy that it fell hard on the day that the stockmarket plunged last week. This suggests that when the stockmarket crashes it will tank. In itself it is not a good sign for gold and silver.
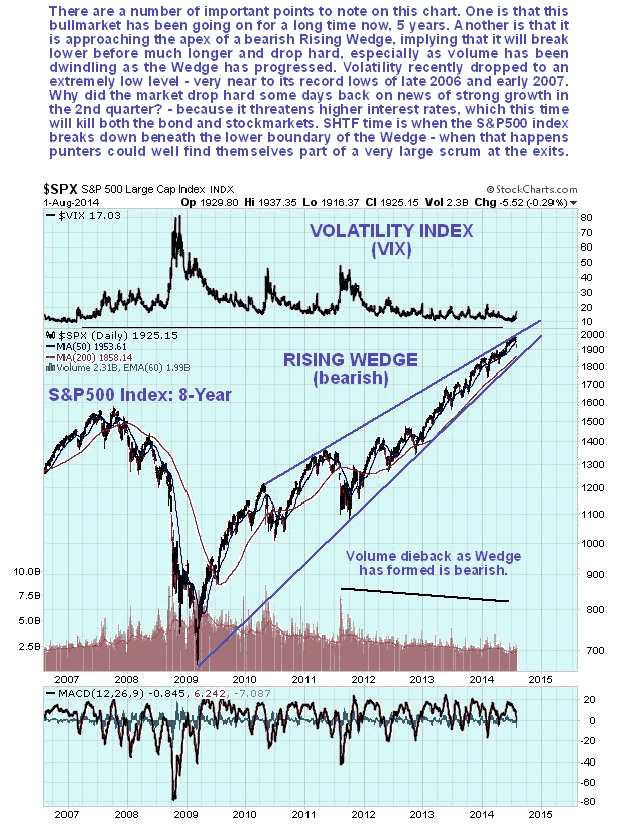
Speaking of the general stockmarket, although it plunged on one day last week, it has still not broken down from the giant bearish Rising Wedge shown on the 8-year chart for the S&P500 index below. When that happens, and it looks likely soon given that the Wedge is now closing up, a lot of market players can be expected to jam the exits, all trying to get out at once, and we could see a particularly disorderly situation and a savage decline. It is considered prudent to get your bear ETFs and Puts on board ahead of time. We will be looking at some soon on the site.
By Clive Maund
CliveMaund.com
For billing & subscription questions: subscriptions@clivemaund.com
© 2014 Clive Maund - The above represents the opinion and analysis of Mr. Maund, based on data available to him, at the time of writing. Mr. Maunds opinions are his own, and are not a recommendation or an offer to buy or sell securities. No responsibility can be accepted for losses that may result as a consequence of trading on the basis of this analysis.
Mr. Maund is an independent analyst who receives no compensation of any kind from any groups, individuals or corporations mentioned in his reports. As trading and investing in any financial markets may involve serious risk of loss, Mr. Maund recommends that you consult with a qualified investment advisor, one licensed by appropriate regulatory agencies in your legal jurisdiction and do your own due diligence and research when making any kind of a transaction with financial ramifications.
Clive Maund Archive |
© 2005-2022 http://www.MarketOracle.co.uk - The Market Oracle is a FREE Daily Financial Markets Analysis & Forecasting online publication.