


AUDUSD Setting Up For Big Reversal
Currencies / Forex Trading Aug 11, 2014 - 04:21 PM GMTBy: Austin_Galt

 The AUDUSD has lost a couple of cents over the last few weeks. So is this the beginning of the next leg down? I doubt it. On the contrary, I believe a big reversal higher is just around the corner. Let’s investigate.
First, let’s refresh ourselves of the big picture to help put it all in perspective.
YEARLY CHART
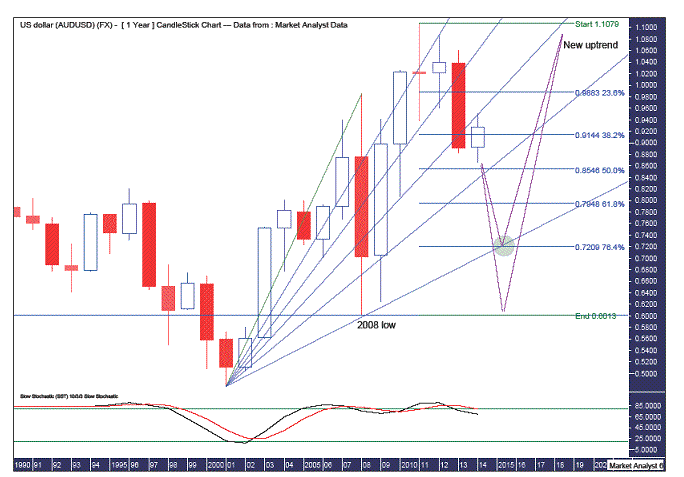
We can see the all time low set in 2001 at 47.78c. Since then price has risen up making a higher high in 2008 before reversing that same year and putting in a higher low. Then another rise saw a new all time high set in 2011 at $1.1079. So we have a massive bull market currently in play. Now we appear to be awaiting the next higher low.
I have added a Fibonacci Fan from the all time low to the 2008 high while I have also added Fibonacci retracement levels of the upleg from the 2008 low to the all time high.
Firstly, there seems to be some symmetry exhibited by the fan. We can see the 2008 low found support at the 76.4% angle. (This was also a near perfect 76.4% retracement from its 2008 high.) The 2009 high found resistance at the 23.6% angle. The 2010 low found support at the 50% angle. The 2012 high found resistance at the 23.6% angle and the low support at the 38.2% angle. And the 2014 high found resistance at the 50% angle. So, this Fibonacci Fan appears to be in-synch with the long term behaviour of the AUDUSD.
Interestingly, the 76.4% angle looks to intersect shortly with the 76.4% retracement level of the 2008 to 2011 uptrend. This level stands at 72.09c and is shown in the green highlighted circle. The intersection is set to take place in 2015. I’m zeroing in on this target for the final correctional low.
I have also had the 61.8% retracement level in mind. This stands at 79.48c. I will certainly be alert to any pattern of trading that alludes to a turning point there. However, at this stage I’m clearly favouring the 76.4%. There is another scenario that has crossed my mind. What is it?
This is the super bearish scenario and involves a retracement right back to the 2008 low at 60.13c. That is the level needed to break the massive bull market. I very much doubt price will break the 2008 low. But it wouldn’t surprise to see price pull up just short of that level, say around the 61c to 62c area. If price were to turn back up there, then a massive double bottom with the trend would be set which should produce an enormously powerful move higher. Something to keep in mind anyway.
I have added a Stochastic indicator which had a bearish crossover in 2013 and looks to have some more downside left in it.
Let’s move on to the monthly chart.
MONTHLY CHART
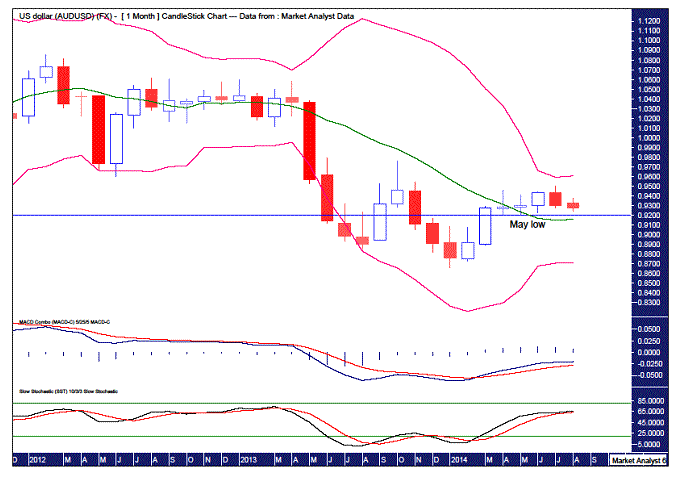
I have drawn a horizontal line which denotes the May low of 92.03c. This has been the low of the consolidation pattern that has been in play since April. I expect that low will hold the current move down. If it doesn’t then I suspect the next leg down will have begun. But I don’t favour this scenario. The June low at 92.29, however, may not be so lucky. It could be regarded as minor support with the May low being major support.
I favour this current move down to bust minor support at 92.29c and to be held by major support at 92.03c. So, what happens after that?
I have added Bollinger Bands and it can be seen price moved away from the lower band and just failed to hit the higher band. I favour price actually getting up and touching that higher band before the next major leg down commences. That higher band is currently situated just above the 96c level.
I have added a Moving Average Convergence Divergence (MACD) indicator and a Stochastic indicator. Both appear to be trending up with no bearish crossovers set to happen this month. So these indicators seem to support higher prices.
That’s the big picture done. Now let’s wrap it up by looking at the small picture – the daily chart.
DAILY CHART
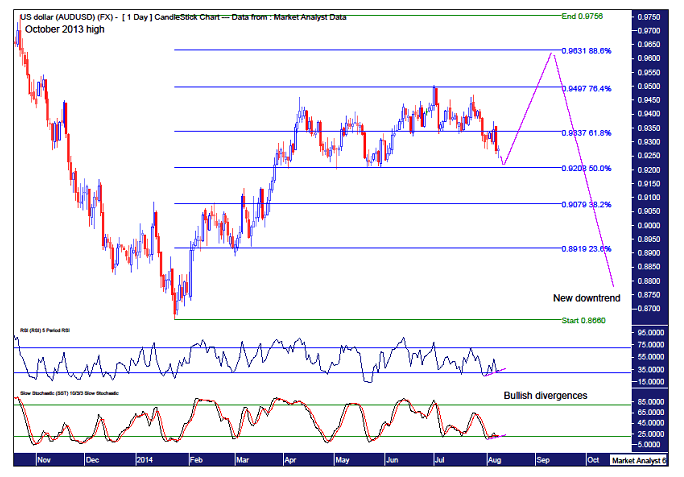
I have added Fibonacci retracement levels of the move down from the October 2013 high to the recent lower low at 86.6c. It can be seen that the current rally high was pretty much a direct hit on the 76.4% level. That is some evidence that the rally has already ended. But I don’t think so. Why not?
The trading still looks corrective in nature. I just don’t see any really impulsive action taking place. I have also added a Relative Strength Indicator (RSI) and Stochastic indicator and both are showing little bullish divergences on the last couple of lows. So I favour one final high to end the corrective rally that has been in force since the January 2014 low.
As the 76.4% level has already been used up, I have added the rarely used 88.6% level which stands at 96.31c. I am targeting this level for my next big play short opportunity. A break above the October 2013 high of 97.56 would most likely mean the bears have been fatally gored. Unlikely in my opinion.
So, as it stands today, the AUDUSD appears on the verge of a big reversal back up any day now. That should lead to one final rally high before the resumption of the main trend – the bear trend.
Bio
I have studied charts for over 20 years and currently am a private trader. Several years ago I worked as a licensed advisor with a well known Australian stock broker. While there was an abundance of fundamental analysts there seemed to be a dearth of technical analysts, at least ones that had a reasonable idea of things. So my aim here is to provide my view of technical analysis that is both intriguing and misunderstood by many. I like to refer to it as the black magic of stock market analysis.
Please register your interest in my website coming soon. Any questions or suggestions, please contact austingalt@hotmail.com
© 2014 Copyright Austin Galt - All Rights Reserved
Disclaimer: The above is a matter of opinion provided for general information purposes only and is not intended as investment advice. Information and analysis above are derived from sources and utilising methods believed to be reliable, but we cannot accept responsibility for any losses you may incur as a result of this analysis. Individuals should consult with their personal financial advisors.
© 2005-2022 http://www.MarketOracle.co.uk - The Market Oracle is a FREE Daily Financial Markets Analysis & Forecasting online publication.